Hepper is reader-supported. When you buy via links on our site, we may earn an affiliate commission at no cost to you. Learn more .

14 Surprising Pet Travel Statistics & Trends: 2024 Update
By Keri-Beth Clur
Updated on Apr 18, 2024

Click to Skip Ahead
Note : This article’s statistics come from third-party sources and do not represent the opinions of this website.
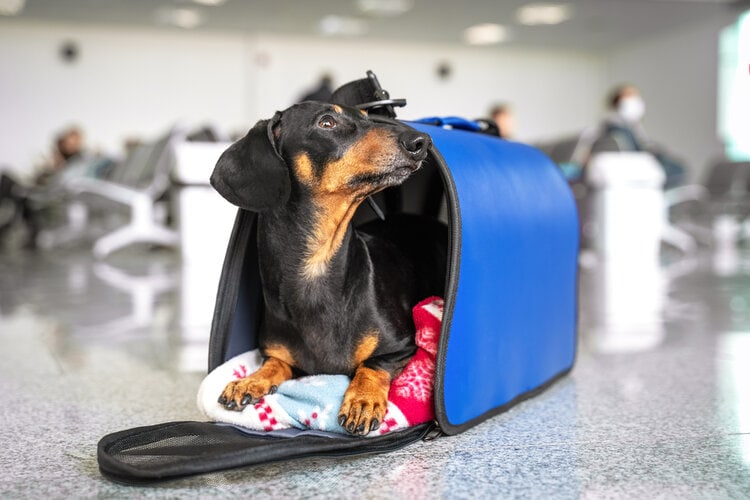
Pet travel has become popular in recent years, and some pet owners even refuse to go on vacation unless their pets can come along with them. Pet travel has come a long way, and there are much fewer restrictions around pets traveling with their owners on planes, buses, trains, etc. More hotels have started opening their doors to cats, dogs, and birds. Many of them don’t discriminate against the type of pet you bring along as long as they’re under the weight limit regulations.
If you’re eager to take your pet along with you on your next adventure but don’t know what to expect, you’ve come to the right place. We’ll discuss all the interesting statistics surrounding pet travel so you can better prepare yourself and know what to look out for, for a stress-free time away.
Top 14 Pet Travel Statistics
- 70% of US households own at least one pet.
- Every year, 78% of Americans travel with their pets.
- More than half of travelers (60%) worldwide take their pets with them when they holiday.
- 25 million dog owners bring their dogs along for a vacation in pet-friendly hotels.
- 37% of dog owners opt to stay home with their pets rather than travel.
- 75% of American hotels ranging from luxury, midscale, and economy, allow pets.
- There are around 3,500 pet-friendly Choice Hotels across the country.
- 81% of pet parents prefer staying in pet-friendly hotels over other forms of accommodation .
- 10% of people have snuck their pets into a hotel through their luggage.
- 58% of people have found the process of traveling with their pets difficult .
- 38% of pet parents find driving with their pets easier than flying with them.
- 29% of pet owners have reported being distracted by their dogs while behind the wheel.
- Alaska Airlines is the most popular airline for pet transportation, flying 107,042 pets in one year.
- Between the start of 2015 and the end of 2020, United Airlines reported 45 pet deaths and 42 pet injuries.
The Growing Interest in Pet Travel
1. 70% of us households own at least one pet..
From 1988 to 2022, pet ownership increased substantially, growing by 14%. In the past 3 years alone, pet households grew by 3%. In 2022, 70% of US households own a pet, which is around 90.5 million families.
2. Every year, 78% of Americans travel with their pets.
(Roanoke Times)
Americans love their pets, regardless of the species. About 95% of people consider their pets to be a part of their family and value them for the happiness and affection they bring. For these reasons and so many more, pets are a welcomed addition to any vacation or long trip.
3. More than half of travelers (60%) around the world take their pets with them when they holiday.
(WagWalking)
According to a survey of pet parents around the country, for 60% of pet owners, a holiday isn’t truly a holiday without their pet, so they bring them along. To cater to the high number of people traveling with their pets, hotels, cities, and restaurants have had to make an effort to change and adapt to make their areas suitable for people as well as pets.
4. 25 million dog owners bring their dogs along for a vacation in pet-friendly hotels.
(Hyatt Newsroom)
Dogs are the pet that travels the most, with 25 million dog owners taking their pups with them to stay at pet-friendly hotels when on vacation. This is mainly because there are more dogs in the US than any other pet, but also because dogs are far easier to travel with than cats.
5. 37% of dog owners opt to stay home with their pets rather than travel.
We all need a holiday sometimes, but that looks different to different people. Some may see a holiday as getting away from their town or city to relax at a beach resort, while others may want to head to the mountains. For 37% of dog owners, a holiday is about being with their pets, and they would rather be with them at home than travel without them.
The Growing Need for Pet-Friendly Accommodation
6. 75% of american hotels ranging from luxury, midscale, and economy, allow pets..
With so many people in the United States owning one or more pets and considering them to be part of their family, hotels have had to stay relevant by evolving with the times and welcoming all types of family members—even furry ones with claws.
When a hotel accepts a person and their pet, it builds loyalty, and many pet parents will return to that hotel knowing that their pet is welcomed and well-cared for. Thankfully, it’s not just the luxury hotels that have made this change but midscale and economy hotels too.
7. There are around 3,500 pet-friendly Choice Hotels across the country.
(Choice Hotels)
If you’re looking for a hotel for you and your pet to stay in but don’t know of any pet-friendly ones, your best bet is a Choice Hotel. This hotel chain has 3,500 pet-friendly options across the country and is commonly found in cities known to cater to dogs, such as St. Petersburg in Florida.
8. 81% of pet parents prefer staying in pet-friendly hotels over other forms of accommodation.
(WagWalking)
Pet-friendly hotels are simply easier for pet parents because they cater to your pet. They usually have outdoor play areas, pet bowls in the hotel rooms, pet beds, and even a pet sitter or walker that is available to look after your fur baby when you go out or do activities.
Staying in a place that caters to your pet is less stressful and more welcoming. For many pet parents, a friendly staff towards your pet is more important than the cost per night.
9. 10% of people have snuck their pets into a hotel through their luggage.
Unfortunately, not every hotel is going to welcome you and your pet into their rooms, as not all hotels cater to pets nor allow them on their premises. This hasn’t stopped 10% of pet parents, though, who have been adamant about getting their furry besties into their hotel rooms—even if that means sneaking them in through their luggage.
The Struggles of Pets and Transportation
10. 58% of people have found the process of traveling with their pets difficult..
It’s not just about how pets will react to new environments and experiences that pet owners have to worry about; it’s also the whole process of getting there.
Finding the right airline, train, bus, etc., for you and your pet to travel with that caters to their bathroom needs is difficult. Other passengers complaining about your pet is another stressful factor. Things like check-in and getting through security are stressful on your own but even more complicated and time-consuming when you have a pet with you.
11. 38% of pet parents find driving with their pets easier than flying with them.
Sometimes, taking the longer journey is the better option if it means that you don’t have to worry about issues with other travelers, check-in, security complications, and confusion surrounding your pet. All these hurdles can make flying stressful and many pet parents avoid flying with their pets at any cost.
12. 29% of pet owners have reported being distracted by their dogs while behind the wheel.
Although the process of traveling with your pet is generally easier when you drive to your destination yourself, there are risks involved. About 29% of pet owners have reported being distracted when on the open road with their dogs. Dogs tend to get bored, restless, or even excited and can become distracting through their behavior.
Without thinking, drivers will try to calm their dogs down or move them away from climbing into the front of their car while still driving, breaking their concentration and focus. This can be very dangerous, as accidents can occur within seconds. Instead, pet owners should try to pull over and tend to their dog’s needs off the road.
13. Alaska Airlines is the most popular airline for pet transportation, flying 107,042 pets in one year.
(Veterinarians.org)
Alaska Airlines transported more pets than any other airline in 2020 and had no incidents while doing it. They have quickly gained the trust of many pet parents who continue to fly their pets through this airline.
Alaska Airlines allows pets that are small enough to fit in an under-seat carrier to fly in the cabin with their pet parent. However, if the pet is too big for the under-seat carrier, they will be required to fly in the baggage compartment, which is also safe and climate controlled.
14. Between the start of 2015 and the end of 2020, United Airlines reported 45 pet deaths and 42 pet injuries.
Over the course of 6 years, United Airlines has transported more than 448,000 animals, but they have also reported 45 pet deaths and 42 pet injuries on their flights. They have an average incident rate of 1.6 and have made it onto the top 3 list for highest incident rates every year.
Frequently Asked Questions About Pet Travel
Are pets allowed to fly with their pet parents.
On some airlines, certain pets are allowed to fly with their pet parents. Carry-on pets accepted in the cabin are usually only cats or dogs that meet the airline’s size, age, and flight length requirements.
Can an airline refuse to fly a pet in the cabin?
Yes, as not all airlines allow pets to fly in the cabin with their pet parents. The ones that do have requirements that must be met. If your pet isn’t listed as one of the types allowed to fly in the cabin, if their carrier is too small for them, if your pet is too big to fit in the under-seat carrier, or if they’re sick or injured, the airline may refuse to let them fly in the cabin or at all.
It’s important to research the airline’s requirements beforehand as each airline is different .
What do pets need to fly?
In some cases, your pet may be required to have a health certificate, identification, copies of your pet’s medical records, and an acclimation certificate for air travel. It’s important to contact your registered veterinarian when you start considering travel plans so that they can do a health check on your pet and sign any documents needed. You should also phone the airline you’re flying with to ask what documentation they require for your pet.
What is the best place to travel with a dog?
Italy is considered one of the top dog-friendly countries in the world. They have a high number of pet-friendly hotels, making accommodation easy. Italy also has laws on animal rights and is a low-risk rabies country.
(The Swiftest)
What is the cheapest way to travel with a pet?
The cheapest way to travel with your pet is also the most popular—and it’s traveling with your own car. This means of transportation allows you to pull over and stop whenever your pet needs to use the bathroom or stretch their legs. You won’t have to worry about other passengers, and it’s less stressful for you and your pet.
However, traveling by car might not be possible if you’re traveling to another country. If you’re keeping your holiday local, just get a carrier and leash for your car to ensure you and your pet are kept safe.
More and more people want to take their pets along with them when they go on vacation. Airlines and hotels have had to evolve with this new trend to maintain loyalty with their customers. However, even with the rise in pet-friendly hotels, pet owners still find traveling with their pets difficult for several reasons. Many have resorted to driving over flying with their pets, and some pet owners choose to rather holiday at home with their pets than go on vacation without them.
- How Much Will It Cost to Ship My Dog? Updated Price Guide
- 10 Best Dog-Friendly Restaurant Chains in the US
- Roanoke Times
- Hyatt Newsroom
- Choice Hotels
- Veterinarians.org
- The Swiftest
Featured Image Credit: javier brosch, Shutterstock
Related Articles
Further Reading
15 Shocking Puppy Mill Facts & Statistics to Know in 2024
Apr 17, 2024 - 13 min read
10 Shocking Australian Animal Homelessness Statistics: 2024 Update
Jan 9, 2024 - 7 min read
How Many Fishkeepers Are There? 2024 Updated Statistics
Feb 9, 2024 - 5 min read
Vet Articles
Latest Vet Answers
The latest veterinarians' answers to questions from our database
Dog Attacked by Porcupine? Our Vet Explains What to Do
Answered by Dr. Rebecca MacMillan, BVetMed MRCVS (Vet)
Rabies in Dogs: Causes, Signs & Care Guide
Answered by Dr. Iulia Mihai
E. Coli Infection in Cats: Vet Explained Causes, Signs & Treatments
Answered by Dr. Chantal Villeneuve, MS BVetMed (Vet)
What to Feed Betta Fish Fry: Our Vet’s Feeding Guide & Growth Tips!
Answered by Dr. Luqman Javed, DVM (Vet)
How Long To Let Fish Acclimate To a New Tank: Our Vet Explains
Can Two Male Betta Fish Live Together? Our Vet Explains
Cat food recalls
Have a cat? Stay on top of cat food recalls here >
Dog food recalls
Have a dog? Stay on top of dog food recalls here >
Have a question? talk to a vet online for advice >

What are you looking for?
55+ pet travel statistics (up-to-date 2023 figures).
Did you know that 7 in ever 10 households in the US own a pet?
But 64% of Millennials who own a pet have claimed to skip travelling because they’re worried about leaving their pets alone at home.
Still, whether by air or road, pet travel has become quite prevalent this days, especially as incident rates continue to decrease.
Just as the trend for solo travel has grown dramatically ( by 761.15% in 2021! ), so has pet travel…
Today, we’ve rounded up the latest statistics on pet travel for you.
Here we go!
Sources : You can see the source for each statistic under the entry, or head over to the bottom of this page for a list of all the sources and articles we’ve used!
Travellerspoint
How many people travel with pets?
- According to IPATA, over 4 million pets and live animals are transported by air per year.
What country has the highest rate of pet ownership?
The US has the highest rate of pet ownership, with around 70 million domestic dogs and 74 domestic cats across the nation.
What airline has the most pet deaths?
In the United States, the airline with the highest incident rate for pet transportation by air is Hawaiian Airlines at a rate of 2.02%. It is followed by United Airlines (1.6%), Delta Airlines (1.05%), and American Airlines (0.71%).

Top Pet Travel Statistics
- Overall, in 2018, 37% of pet owners bring their animals along on trips, compared to just 19% in 2008
- A 2018 survey by GoPetFriendly revealed that the most popular transportation type for pet travel is car or pick-up (63.8%)
- Less than 0.01% of pets that travel by air have an incident, which means that more than 99.99% arrive at their destination safely
- The best airline in the United States for pet transportation is Alaska Airlines, which transported the most pet passengers in 2020 (107,042 total)
- 82% of dog owners report to feeling worried about their dog when they are traveling away
- 25 million people who own dogs as a pet take them on vacation in pet-friendly hotels
- 56% of respondents drive with their dog in a vehicle at least once a month over the past year
Pet travel demographics
How many people travel with dogs?
1. As of 2018, there’s a total of 471 million dogs kept as pets worldwide.
2. meanwhile, there are 373 million cats kept as pets across the globe., 3. in 2022, 70% of households in the us own a pet (90.5 million families).
From 1988 to 2022, pet ownership continued to grow by 14% in the US, until approximately 90.5 million families owned a pet in the US in 2022.
4. In 2023, the top country in terms of pet ownership for both dogs and cats is the US, with approximately 70 and 74 million dogs and cats kept as pets respectively.
[WorldPopulationReview]
5. Dog ownership is second most prevalent in Brazil, with approximately 35 million domestic dogs.
6. meanwhile, the country with the second highest number of pet cats is china, with roughly 53 million domestic cats., 7. overall, in 2018, 37% of pet owners bring their animals along on trips, compared to just 19% in 2008..
[Traveling Cook]
8. A 2018 survey by GoPetFriendly revealed that the most popular transportation type for pet travel is car or pick-up (63.8%).
[GoPetFriendly]
9. After that is traveling by motorhome or RV (28.3%).
28.3% of respondents prefer to travel by motorhome or RV with their pets, which represents a huge part of the RV community .
10. Flying appeals to 6.3% of the survey respondents, while 1.7% prefer other modes of transportation.

Pet travel by air
11. according to ipata, over 4 million pets and live animals are transported by air per year., 12. the number in the us alone amounts to 2 million pets and live animals transported by air annually..
About 2 million pets and live animals travel by air in the US per year.
13. Less than 0.01% of pets that travel by air have an incident, which means that more than 99.99% arrive at their destination safely.
14. in fact, as of december 2022, american airlines reported a total of 12 incidents (fatalities and injuries included) when transporting animals by air, a decrease from the 17 fatalities in 2014 and 39 deaths in 2010..

15. IPATA claims that the main reason for the decreasing number of incidents is that more people are using professional pet shipping services.
16. according to a research by eq living, the best airline in the united states for pet transportation is alaska airlines, which transported the most pet passengers in 2020 (107,042 total)..
[EQ Living]
They’re followed by American Airlines (80,817), Horizon Air (38,813), Delta Airlines (18,943), and SkyWest Airlines (16,805).

17. Alaska Airlines also reported up to 6x lower in incident rate compared to United Airlines.
managed to not only transport the most animals but also reported an incident rate more that six times lower than the average incident rate of United Airlines during the same time period.
18. On the other hand, the American airline with the highest incident rate is Hawaiian Airlines (2.02%).
19. it’s followed by united airlines (1.6%), delta airlines (1.05%), and american airlines (0.71%)., leaving pets while traveling statistics, 20. 82% of dog owners report to feeling worried about their dog when they are traveling away., 21. as a result, 88% of dog owners have attempted to ensure that their dog doesn’t feel lonely when left at home., 22. for 46% of them, this includes buying special toys and treats that are given only when the owners are away., 23. another 46% of owners would keep the tv or radio on for their dogs when they are away., 24. finally, 26% report to getting another pet to accompany their dog., 25. for 14.2% of pet owners, their biggest worry when travelling without their pets is that they might miss them and not understand why they left., 26. a larger proportion of owners (20.8%) are worried that their pets will not receive the same quality of care they could provide., 27. more than half of dog owners (56%) say that they forego travelling due to concern about costs of their dog’s care., 28. millennial dog owners are more likely to skip travelling because of this reason, with 64% of them choosing not to travel due to their pet..
64% of millennial travelers who own a pet choose not to travel due to their pet.
Pet travel accommodation trends
29. 25 million people who own dogs as a pet take them on vacation in pet-friendly hotels., 30. meanwhile, 35.4% of pet owners opt to book campgrounds or rv parks when traveling with pets., 31. 75% of all hotels in the us allow pets..
Roughly 75% of hotels in the US allow pets, including luxury, mid-scale, and budget hotels.
32. Out of these pet-friendly hotels in the States, 2,500 of them are part of the Choice Hotels chain.
33. 81% of pet owners choose to stay in pet-friendly hotels over other types of accommodation., 34. 1 in 10 hotel guests have snuck their pets through their suitcase into the hotel., 35. 29.7% of leisure travelers say that pet-friendly policies are important when choosing travel accommodations..
Whether in an Airbnb , hotel or other accommodation, 29.7% of people travelling with a pet will look at the pet-friendly policies when considering their options.
36. Meanwhile, 50.3% of them think that pet-friendly policies are very important in choosing travel accommodations.

37. 36% of travelers in Italy aren’t willing to spend more for pet-friendly facilities. They say that it’s enough that those structures allow for pets.
For 36% of travelers in Italy, including those in Rome, they're not willing to splurge for pet-friendly facilities.
38. However, 30% of them are willing to spend 5 to 10% more for pet-friendly facilities.
39. italians willing to spend between 20 and 30% more of their holiday expenses for pet-friendly facilities make up only 3% of all respondents., car travel with pets, 40. in 2018, only 0.8% of pet owners never took their pet in a vehicle..
This means that an overwhelming majority of pet owners have taken their pets to travel in a vehicle.
41. 56% of respondents drive with their dog in a vehicle at least once a month over the past year.
42. 29% report to being distracted by their dog while driving., 43. while driving with dogs, respondents admit to engaging in distracting activities such as petting them (52%), using their arms to hold their dog in place when braking (23%), reaching to the backseat to interact with their dog (18%), and even taking a photo of their dog (3%)..

44. 83% of respondents agree that it’s dangerous to have an unrestrained dog in a moving car.
45. in fact, 3 in 10 respondents have heard of car crash accidents where unrestrained dogs are either injured or the cause of injury to the human passengers., 46. however, just 16% of dog owners who have driven with their dogs use restraint while traveling with them., 47. out of this 16%, the most common type of dog restraint in a car is a pet harness or safety belt (56%), followed by travel crates (37%) and pet vehicle seats (10%)..

48. According to AAA, a car’s airbag system can be deadly to a dog sitting in the front seat. It is thus advised to place them in a backseat with some form of restraint.
Pet travel top destinations, 49. the type of vacation that pet owners enjoy the most with their pets is going to a destination with fresh air and lots of hiking (42.9%)., 50. the second most popular vacation type with pets is going to a national park or historic site (18.3%)., 51. surprisingly, only 15.4% of pet owners say that going to a dog-friendly beach is their favorite type of vacation to take with their pets., 52. meanwhile, 10.8% prefer other types of vacations with pets..

53. 27% of respondents in a 2015 survey said that they always take their pets when going on camping vacations.

54. Meanwhile, 26% say sometimes, 8% rarely, while 39% of respondents never take their pets on camping vacations.
Types of pets that travel, 55. the most common type of pet that travels is dogs, making up about 58% of all pets travelling across the globe..
[PBS Pet Travel]
56. The second highest number of pets travelling is cats, at 22%.
57. unexpectedly, birds come in third place as the pets that travel the most, ahead of other animals such as horses and other smaller mammals..
Despite the significant 72.4% fall in global tourism in 2020 due to the Covid-19 pandemic, it’s clear that travelling with pets has become a steadily growing trend.
Across the world, dogs and cats remain the most popular types of domestic animals people like to travel with.
Can you think of anything we didn’t cover about pet travel?
Let us know by commenting below!
Check out some of these other interesting stats:
- Digital Nomad Statistics
- Business Travel Statistics
- France Travel & Tourism Statistics
- Glamping Statistics
- WorldPopulationReview
- Traveling Cook
- GoPetFriendly
- PBS Pet Travel

Leave a comment
Let us know what you think.

5 million people can't be wrong
- Dog Health & Care
- Dog Nutrition
- Dog Training
- Vet Approved
12 Interesting Pet Travel Statistics & Trends to Know: 2024 Update

Last Updated on March 24, 2024 by Dogster Team

Click to Skip Ahead
Note: This article’s statistics come from third-party sources and do not represent the opinions of this website.
With more pet-friendly accommodations and attractions, more and more people are opting to take their pets with them on vacation instead of leaving them with family or in a boarding facility.
If you’re wondering about this rising trend, check out these 12 pet travel statistics in the US and around the world.

Top 12 Pet Travel Statistics
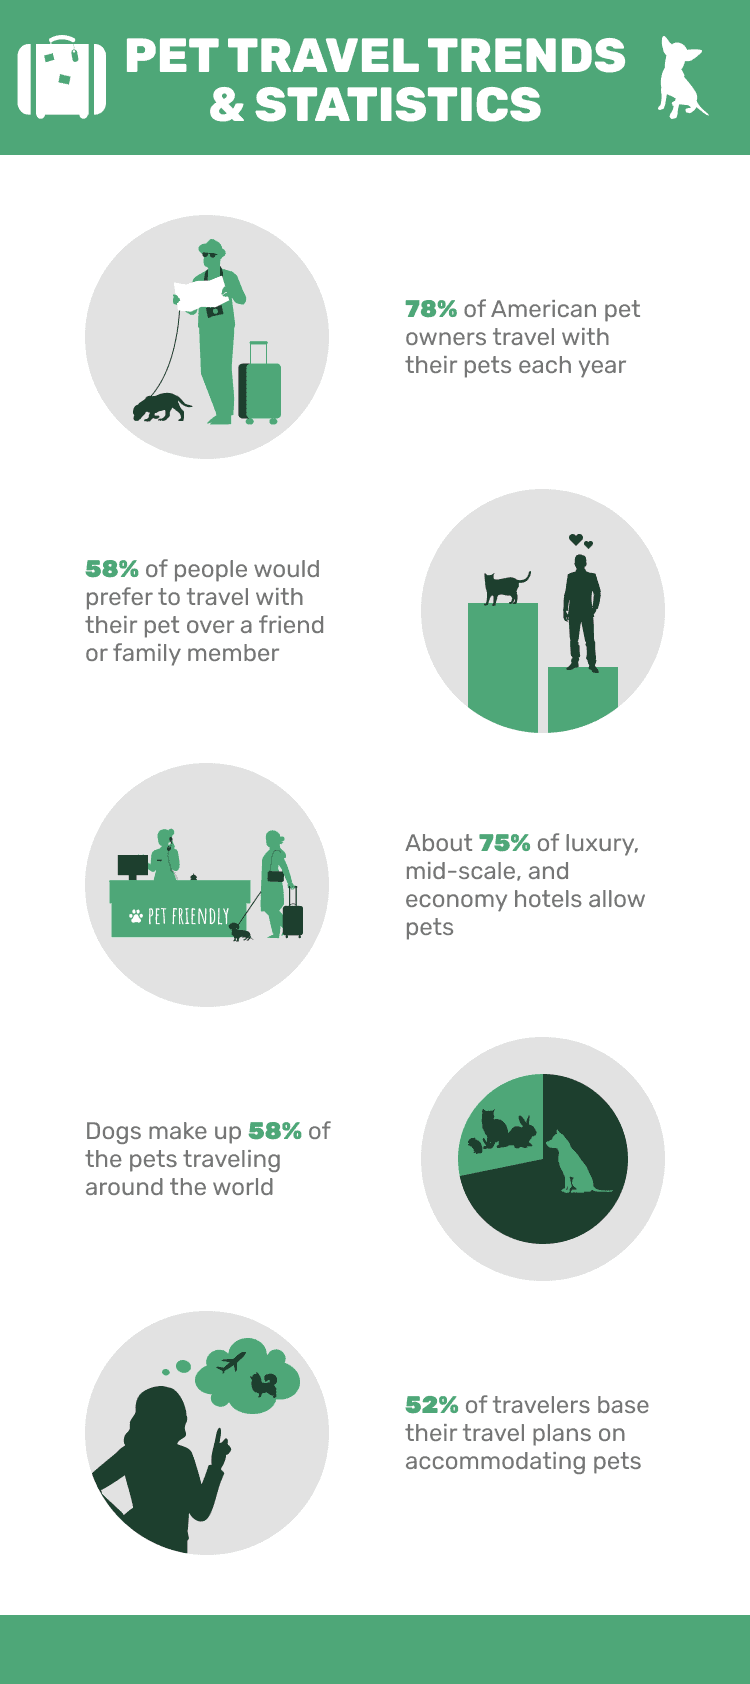
- 78% of American pet owners travel with their pets each year.
- 54% of cat and dog owners plan to travel with their pet .
- 58% of people would prefer to travel with their pet over a friend or family member.
- 52% of travelers base their travel plans on accommodating pets .
- About 75% of luxury, mid-scale, and economy hotels allow pets.
- In 2019, a total of 404,556 animals were transported by airline.
- Nearly 64% of travelers prefer to travel with pets by car .
- 9% of people look for a destination with hiking and fresh air for pet travel.
- Dogs make up 58% of the pets traveling around the world .
- 37% of owners take shorter vacations because of their pets.
- 10% of travelers have hidden their dogs to travel .
- 27% of dog owners go the extra mile for their pets.
General Pet Travel Statistics
1. 78% of american pet owners travel with their pets each year..
(Roanoke Times)
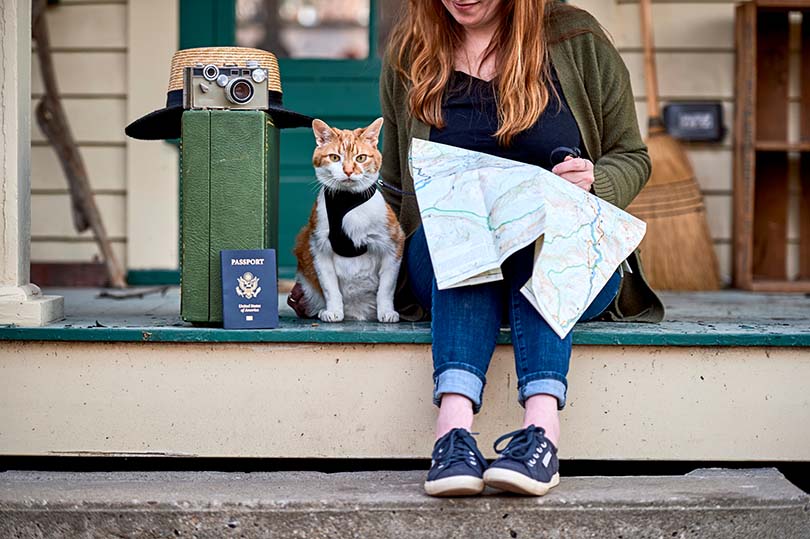
Instead of boarding or paying for a pet sitter, more people are choosing to travel with their pets. After all, they’re part of the family. According to research from Roanoke Times, 78% of pet parents travel with their pets each year.
2. 54% of cat and dog owners plan to travel with their pet.
(Lodging Magazine)
New research from Motel 6 reveals that Americans are traveling with their pets. Roughly 54% of cat and dog owners plan to travel with their pets in the next year, based on data compiled from 1,000 participants who are planning a trip.
3. 58% of people would prefer to travel with their pet over a friend or family member.
According to the Hilton global trends report, 58% of survey respondents said they’re planning to travel with their pets and actually prefer it over traveling with a friend or family member.
4. 52% of travelers base their travel plans on accommodating pets.
(Harvest Hosts)
More than half of all travelers base their travel plans on accommodating their pets, with millennials being the most likely to consider traveling with their pets. Furthermore, over one-third of travelers consider pet-friendly accommodation a “must.”
Pet-Friendly Accommodation
5. about 75% of luxury, mid-scale, and economy hotels allow pets..
(American Kennel Club)
About 75% of luxury, mid-scale, and economy hotels now allow pets to address the growing demand for pet-friendly travel. Popular chains like Red Roof, Motel 6, Best Western, Choice Hotels, and DoubleTree by Hilton are among them. It’s important to always call and double-check before your trip, however.
6. In 2019, a total of 404,556 animals were transported by airline.
According to research from Forbes, in 2019, a total of 404,556 animals were transported by airline. While some of these animals may have been for the pet trade or research purposes rather than pet travel, that’s a lot of animals making a trip by air.

7. Nearly 64% of travelers prefer to travel with pets by car.
(GoPetFriendly)
According to research from Go Pet Friendly, 63.8% of survey respondents prefer to travel by car. The second most popular choice is traveling by motorhome or RV, followed by flying.
8. 9% of people look for a destination with hiking and fresh air for pet travel.
Travelers look for diverse experiences when traveling with pets, but 42.9% look for a destination with hiking options. Next is a national park or historic site, which may or may not allow pets, followed by a dog-friendly beach. 12.5% of travelers look for pet-friendly cities.

Miscellaneous Pet Travel Statistics
9. dogs make up 58% of the pets traveling around the world..
(PBS Pet Travel)
Dogs make up 58% of all pets traveling around the world. Cats come in second at 22%, followed by pet birds, then horses.
10. 37% of owners take shorter vacations because of their pets.
(Travel Agent Central)
Based on a survey of 500 dog owners, 37% said they chose not to travel in order to stay home with their dog. 38% have chosen to drive instead of flying if taking their dog was not an option.

11. 10% of travelers have hidden their dogs to travel.
Some travelers won’t let anything stop them. 10% of travelers have smuggled their dog into a hotel in luggage, even if the hotel wasn’t pet-friendly. Another 3% have tried to disguise their dog as a baby to board a plane. And another 7% have dressed their dogs as service animals to gain special access, even if they’re not a service animal.

12. 27% of dog owners go the extra mile for their pets.
Young dog owners go above and beyond for their pets while traveling. 27% of dog owners between 21 and 24 years of age scheduled day and evening care for their pets. Another 17% create a music playlist. Baby boomers are more likely to take their pets with them, though 25% make homemade treats for their pets to enjoy while they’re away.
Frequently Asked Questions About Pet Travel
What is a pet passport.
A pet passport is a collection of documents that you need to travel with your pet to a foreign country. Depending on the destination, this may include health and rabies certificates, test results, or other documents issued by your veterinarian or customs officials. (USDA)
What Do I Need to Travel with My Pet in the US?
You don’t need a health certificate to travel across state or territory lines, though some states may require special health clearances. It’s best to check with your veterinarian about any vaccines your pet will need to address local diseases. (USDA)
Who Should I Speak with About Traveling With My Pet?
Before traveling with your pet, speak to your veterinarian and ensure that your accommodation, including flights, hotels, motels, campgrounds, or parks, allow pets. If you’re traveling to another country, speak to a foreign consulate or regulatory agency to see what’s required to bring your pet into the country. (AVMA)
Is It Safe to Travel with Pets?
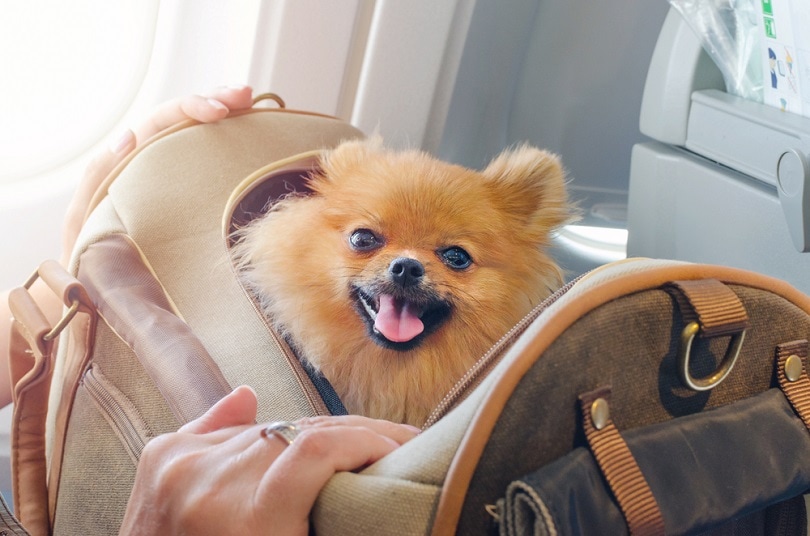
With planning and preparation, traveling with pets can be safe. It’s best to avoid air travel unless your pet is small enough to ride under the seat, however. Riding in the cabin as checked baggage can put your pet at risk.
If you have to travel with your pet by air, make sure to use a USDA-approved shipping crate and alert all airline personnel to the fact that you’re traveling with a live animal. It’s best to book direct flights to avoid any layovers as well. (USDA)
Can Pets Travel on Long Car Trips?
If you want to take your pet on a trip and flying isn’t an option, traveling by car is a good option. You have to prepare for a long-distance trip with your pet, however, by getting a well-ventilated crate and planning a pet-friendly travel kit with a bowl, food, plastic bags, a waste scoop, grooming supplies, medication, and travel documents .
You also need to plan for your stops along the trip. Not all hotels are pet-friendly, so you have to prepare for your rest stops on your route. Never leave a dog or cat alone in a parked vehicle, especially in hot or cold weather. (ASPCA)
Should I Travel with My Pet?
While it’s great to take your dog or cat with you while traveling, some pets aren’t suited for long trips in the car or flights. Pets that have illnesses, injuries, or nervous or aggressive temperaments or older pets may not be ideal for traveling.
If your pet isn’t good with travel, it’s better to look into boarding or a pet sitter to ensure your pet is cared for while you’re away. (AVMA)
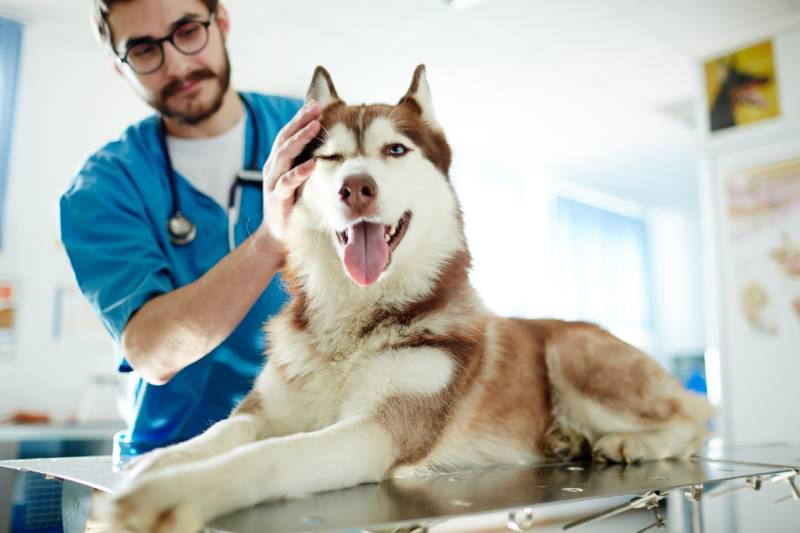
Leaving a pet behind for a vacation can be hard. They’re family, after all. Plenty of people travel with their pets , as evidenced by these statistics. As the trend grows, more accommodation options are welcoming cats and dogs to make travel easier with pets.
- Does Hilton Allow Cats? Company Info
- Surprising Pet Hotel Industry Statistics
- Roanoke Times
- Lodging Magazine
- Harvest Hosts
- American Kennel Club
- GoPetFriendly
- PBS Pet Travel
- Travel Agent Central
- American Veterinary Medical Association
Featured Image Credit: Masarik, Shutterstock
About the Author
Nicole Cosgrove
Nicole has loved animals of all sizes her whole life so it's no wonder she has dedicated her career to helping them through what she loves best: learning, writing, and sharing knowledge with others. She’s the proud mom of two dogs, a cat, and a human. With a degree in Education and 15+ years of writing experience, Nicole wants to help pet parents and pets around the planet to live happy, safe, and healthy lives.

Bichon Frise Colors & Patterns (With Pictures)

ESA Doctors Letter Service Review 2024: Our Expert’s Breakdown

10 Best Biodegradable Dog Poop Bags in 2024 – Reviews & Top Picks
Get dogster in your inbox.

Air Pocket in a Dog’s Ear: Signs, Causes, Care & FAQ (Vet Answer)

Dalmatian Heeler (Dalmatian & Blue Heeler Mix): Info, Pictures & Care Guide
© pangolia pte. ltd. all rights reserved..

The State of Pet Travel in 2022
Predictions & reflections from pet relocation experts.
Our team has spent the last two years in a constant state of learn-and-adapt. Luckily, the pet travel industry has always required agility and creativity, so we had the right people for the job when COVID struck and flipped the pet travel industry upside down.
As we head into 2022, what is the state of pet travel now? Are pet travel regulations calming down? Will things ever go “back to normal,” or will pet flights and ground transportation options forever be more limited—and will countries’ pet travel restrictions forever be this complicated?
We posed these questions to a handful of our team members who specialize in different regions of the world and phases of the pet relocation process. Here’s what they think 2022 has in store for pet parents planning to move their furbabies:
“Pet travel was majorly impacted by the COVID pandemic in 2020 and 2021, and we will still see complications with pet travel in 2022 as the pandemic continues. However, just as everyone has had to learn how to operate in this ‘new normal’ within our own lives and industries, so have pet shippers. While the pandemic will continue to play a role in the way pets travel globally in the new year, the whole pet travel industry— including airlines, ground transportation companies, government departments, and our team at PetRelocation—is more prepared to navigate these challenges. Because of this, 2022 is a far better year to be relocating your pet(s) than 2020 and 2021 were, even if the process continues to require more effort and adaptability!” —Allie Parry, Senior Sales Consultant
“The global pandemic shook the pet relocation industry to its core and forced us all to revise our processes, analyze gaps in supply chains, and come out the other side better than ever. To adapt to new and frequently changing pet travel restrictions, which are extremely nuanced country to country, we now share even more detailed information with our clients—educating pet parents on how the routing of pet travel is engineered, and how all pieces of a pet’s relocation need to align with travel regulations. Through this forced revamp, we’ve determined ways that we can share pet travel information with pet owners even more clearly; and of course, knowledge is power! While pet travel will continue to be more complicated in 2022 than it was in a pre-COVID world, our company and partners are better equipped to handle and communicate these complications than we were in 2020 or 2021.” —Kelcey Shafer, Global Client Services Coordinator
“I think it’s important to understand that there are always factors outside a pet relocation company’s control that can cause delays or setbacks. It’s all about being flexible and rolling with the punches. In 2022, I wouldn’t be surprised if we continue to see issues with travel embargoes and new requirements—such as a handful of countries continuing to require COVID testing for cats! These nuanced import requirements are constantly changing and can throw a wrench in plans just before a move. Having the right pet relocation company on your side to create contingency plans or go toe to toe with an airline or government office on your pet's behalf is a worthwhile investment now more than ever, to reduce the stress brought on by last-minute changes.” —Natalie Garinger, Global Vet Support Specialist
“There are many parties at play in a pet’s relocation that require extensive coordination to align: veterinarians, government entities (such as the USDA), airlines, ground carriers, customs clearance, and more. We expect coordination and clarity between these parties to improve slightly in 2022 , but the pandemic has made adaptability and flexibility more key than ever for planning a pet relocation—and this will continue to be the case throughout the year ahead. Having a pet relocation company on your side provides creative planning, expert knowledge, and a well-connected team who can assist if challenges arise.” —Garrett Breaux, Global Logistics Coordinator
There you have it! Just as the world at large is forever altered and continuously adjusting, entering into the third year of the global pandemic, pet travel is just the same; things are generally getting better as we all learn more, but we unfortunately can’t expect pet travel to return to what it was before 2020. And it was never simple to begin with!
You can set yourself and your pet up for success in 2022 by:
- Starting the relocation planning process 3-6 months in advance.
- Reading up on the requirements in your destination country .
- Understanding that aligning your pet’s travel timeline with your own may not be possible—especially if you’re moving on a tight timeline or to a far away location. We know it’s hard to be away from your best friend(s) for any length of time, but safety is more important than speed when it comes to pet relocation, and having realistic expectations is key.
If you’re interested in hiring PetRelocation for full-service relocation support in 2022 , we recommend reaching out as soon as you know about your pet’s move! Before reaching out, please check out our pricing and use this guide to calculate the cost of your pet relocation . If our Complete Relocation Support feels like a good fit for your budget and needs, feel free to contact us by filling out this request form .
We wish your pet(s) safe and happy travels throughout 2022!

- Schedule a Demo
- Login / Support
Pet Travel Trends – June 2023
by Ali Oaks | July 19, 2023

According to the 2021-2022 APPA National Pet Owners Survey , a resounding 70% of U.S. households own a pet. Of the 90.5 million homes with furry friends, approximately 78% of these American pet owners travel with their companions each year.
The 2022 pet ownership statistics also revealed that cats and dogs are the most popular of all species to travel alongside their human counterparts!
In this monthly series, we highlight the top five domestic and international destinations dogs and cats traveled to with GlobalVetLink pet health certificates . Check out these pet-friendly vacations for traveling with dogs or cats, and start planning your next trip!
Top Destinations in June 2023 Best Pet-Friendly Vacation Spots

Offer Compliant Pet Travel Services
Interested in offering international and domestic pet travel services but not sure where to start.
If you have clients traveling with cats , traveling with dogs internationally , traveling with dogs to Hawaii, or traveling to other domestic destinations, GlobalVetLink is the perfect solution for creating compliant health certificates for pet travel .
Check out these free eBooks to discover how pet travel can drive clinic revenue and how to price your services!

Getting Started with IHCs
This eBook has all the essential details you need to efficiently create 100% compliant travel documents for your patients. Included are step-by-step guides and solutions that can create IHCs in under 5 minutes.
How to Use Pet Travel to Drive Clinic Revenue Growth
Download this free eBook to read about trends in pet travel and discover how to leverage the growing pet travel industry to drive clinic revenue.
Are you a pet owner planning a trip with your furry friend?
Whether you're looking to take your furry friend on a road trip to another state or planning a flight to another country with your furry companion, GlobalVetLink can help you navigate the complex world of pet travel , including compliance with international regulations.
Tell us about your upcoming trip on FlyWithMyPet.com, and we’ll help you quickly and easily find what your pet needs so they can join you on your next adventure!
Getting Started is Free!
With no monthly minimums or subscription requirements and unlimited user accounts for veterinarians and staff, GlobalVetLink brings you the most convenient and comprehensive platform for animal health and movement regulatory compliance.
Create your GlobalVetLink account today to get started automating accurate compliance documents in under 5 minutes. Choose the right plan based on your document volume.
- Privacy Policy
- Consumer Goods & FMCG ›
Pets & Animal Supplies
Pet ownership in the U.S. - statistics & facts
Pet ownership rates in the u.s., covid-19 impact on pet ownership, key insights.
Detailed statistics
Number of U.S. pet owning households by species 2023
Sales of pet food worldwide 2010-2023
Spending on pets per year in the U.S. 2020, by species
Editor’s Picks Current statistics on this topic
Current statistics on this topic.
Generational share of pet ownership in the United States 2023
U.S. pet industry expenditure 1994-2023
Related topics
Recommended.
- Pet food industry in the United States
- Pet insurance in North America
- Pet market in Europe
- Pet insurance in the UK
- Online pet care market in the United States
Recommended statistics
- Premium Statistic Pet-ownership: household penetration rate 1988-2023
- Premium Statistic U.S. pet industry expenditure 1994-2023
- Premium Statistic U.S. pet market sales by category 2018-2022
- Premium Statistic U.S. pet store revenue distribution 2021, by category
Pet-ownership: household penetration rate 1988-2023
Household penetration rate for pet-ownership in the United States from 1988 to 2023*
Pet industry expenditure in the United States from 1994 to 2023 (in billion U.S. dollars)
U.S. pet market sales by category 2018-2022
Pet market sales in the United States from 2018 to 2022, by category (in billion U.S. dollars)
U.S. pet store revenue distribution 2021, by category
Distribution of pet store revenue in the United States in 2021, by category
Species & state breakdown
- Premium Statistic Number of U.S. pet owning households by species 2023
- Premium Statistic States with the highest pet ownership rates in the U.S. 2024
- Premium Statistic States with the highest dog ownership rates in the U.S. 2024
- Premium Statistic States with the highest cat ownership rates in the U.S. 2024
Number of pet owning households in the United States in 2023, by species (in millions)
States with the highest pet ownership rates in the U.S. 2024
Pet ownership rates in the United States in 2024, by leading state
States with the highest dog ownership rates in the U.S. 2024
Dog ownership rates in the United States in 2024, by leading state
States with the highest cat ownership rates in the U.S. 2024
Cat ownership rates in the United States in 2024, by leading state
Pet treatment
- Premium Statistic Owners who buy their pets birthday or holiday gifts in the U.S. 2022, by age
- Premium Statistic Usage of Halloween pet costumes in the U.S. 2021
- Premium Statistic Top ranked Halloween costumes for pets in the United States in 2021
- Premium Statistic Pet owners with monthly pet supplies subscription boxes U.S. 2021, by generation
Owners who buy their pets birthday or holiday gifts in the U.S. 2022, by age
Do you buy gifts for birthdays or holidays for any of your pets?
Usage of Halloween pet costumes in the U.S. 2021
Share of consumers who will dress their pet in a costume for Halloween in the United States in 2021
Top ranked Halloween costumes for pets in the United States in 2021
Most popular Halloween costumes for pets in the United States in 2021
Pet owners with monthly pet supplies subscription boxes U.S. 2021, by generation
Share of pet owners with monthly pet supplies subscription boxes in the United States in 2021, by generation
COVID-19 & inflation impact
- Premium Statistic How COVID-19 affected pet ownership in the U.S. 2020-2022
- Premium Statistic New pet ownership due to COVID-19 in the U.S. 2020/21, by generation
- Premium Statistic Dog acquisition and ownership patterns during the pandemic U.S. 2020
- Premium Statistic Cat acquisition and ownership patterns during the pandemic U.S. 2020
- Premium Statistic Impact of the current economy on pet ownership in the U.S. in 2022
- Premium Statistic U.S. price increase per unit of cat and dog food 2022, by category
- Premium Statistic U.S. consumer attitudes towards pet care products and the economy 2022
- Premium Statistic U.S. consumer attitudes towards their pets in the current economy 2022
How COVID-19 affected pet ownership in the U.S. 2020-2022
How has your pet ownership been affected by COVID-19?
New pet ownership due to COVID-19 in the U.S. 2020/21, by generation
Share of respondents who got a new pet due to COVID-19 in the United States in 2020 and 2021, by generation
Dog acquisition and ownership patterns during the pandemic U.S. 2020
Pet acquisition and ownership patterns among dog owners during the coronavirus pandemic in the United States in 2020
Cat acquisition and ownership patterns during the pandemic U.S. 2020
Pet acquisition and ownership patterns among cat owners during the coronavirus pandemic in the United States in 2020
Impact of the current economy on pet ownership in the U.S. in 2022
How has your pet ownership been affected by the current economy?
U.S. price increase per unit of cat and dog food 2022, by category
Increase in price per unit of cat and dog food in the United States in 2022, by category
U.S. consumer attitudes towards pet care products and the economy 2022
Consumer attitudes towards pet care products and the economy in the U.S. in 2022
U.S. consumer attitudes towards their pets in the current economy 2022
Personal attitudes of consumers towards their pets in the current economic climate in the U.S. in 2022
Further reports Get the best reports to understand your industry
Get the best reports to understand your industry.
- Pet food in the U.S.
- Pet food in the United Kingdom (UK)
- Pet food consumption in Great Britain (Kantar Media TGI)
Mon - Fri, 9am - 6pm (EST)
Mon - Fri, 9am - 5pm (SGT)
Mon - Fri, 10:00am - 6:00pm (JST)
Mon - Fri, 9:30am - 5pm (GMT)
SAILING UPDATES

- Poole to Guernsey
- Portsmouth to Guernsey
- UK to Guernsey
- Jersey to Guernsey
- St Malo to Guernsey
- View all ferries to Guernsey
- Poole to Jersey
- Portsmouth to Jersey
- UK to Jersey
- Guernsey to Jersey
- St Malo to Jersey
- View all ferries to Jersey
- Poole to St Malo
- Jersey to St Malo
- Guernsey to St Malo
- View all ferries to St Malo
- Poole to Cherbourg
- Guernsey to Cherbourg
- Guernsey to the UK
- Jersey to the UK
- St Malo to the UK
- View all ferries to the UK
- Group Travel
- Sailing Updates
- Vehicle size guide
- Travelling with your bike
- Travelling with pets
- Travelling with freight
- Travelling as a foot passenger
- Disabled facilities
- Advanced Passenger Information (API)
- Portsmouth Port
- Guernsey Port
- Jersey Port
- St Malo Port
- Cherbourg Port
- Special Offers
- Luxury 5* Hotels
- St Peter Port Hotels
- St Martin Hotels
- Hotels with pools
- Beach Hotels
- View all Guernsey Hotels
- Short Breaks
- Family Holidays
- Pet-friendly Holidays
- Self-catering
- View all holidays to Guernsey
- St Helier Hotels
- St Brelade Hotels
- St Aubin Hotels
- View all Jersey Hotels
- View all holidays to Jersey
- Guernsey to France
- Guernsey to UK
- Jersey to France
- Jersey to UK
- Jersey to Sark
- Top things to do in Guernsey
- Food & Drink
- Outdoor & Adventure
- Attractions
- See more things to do in Guernsey
- Top things to do in Jersey
- See more things to do in Jersey
- Top things to do in St Malo
- See more things to do in St Malo
- Top things to do in the UK
- See more things to do in the UK
- Onboard Seating
- Bars & Dining
- Live Vessel Positions
- Condor Ferries Blog
FERRY + HOTEL
Your return date must be after your departure date.
Maximum of 9 passengers allowed on the outward.
Please select at least one adult to travel.
Please call 0345 609 1024 to book.
If you are travelling on business or in a commercial vehicle please click here for Condor Ferries Freight .
Please note that any person or vehicle travelling for business or commercial venture, carrying commercial goods/samples will need to book via our freight teams and do not qualify for leisure fares. In addition, if the vehicle being taken is designed for the carriage of commercial goods it shall be reserved as freight regardless of its dimensions. For more information please call the Commercial team on 01481 728620 .
Please wait while we find the best fares for you...
Pet Travel Statistics 2020-2021
- / Pet Travel Statistics
Explore Pet Travel Trends on Type of Pets, Destinations & Mode of Transport!
Over half of pet owners are planning to travel with their pets and roughly 2 million domestic animals board commercial flights each year. Pet travel is an important part of the travel industry and should not be taken lightly or ignored. With over a third of owners saying they simply won’t travel without their pets, making traveling with pets as accessible as possible would be beneficial for both travellers and businesses.
Owners often sacrifice the length and the frequency of their vacations as a result of having animals, and many hold pet-friendly accommodations and destinations in high regard. Increasing the options and ease with which owners can take their furry friends may encourage these travellers to take longer, as well as more frequent trips and dog-friendly holidays in Jersey . Read on for more information, as we explore the facts and figures behind pet travel in recent years.

TOP PET TRAVEL TRENDS:
53% of travelers take holidays with their pets, so pet-friendly accommodation is a growing industry trend.
It’s estimated that 2 million domestic animals travel on commercial flights every year.
52% of surveyed owners said that they only stay at pet-friendly properties.
6% of pets in the US board a plane every year.
27% of people said that they want to see more dog-friendly hotels and holiday parks. 16% would also like to see this in pubs.
15% would like to see more dog-friendly beaches , while 14% want more dog-friendly restaurants.
A recent poll found that 27% of pet owners are planning one or two trips with their furry friends in the next year.
37% are planning 3 to 5 getaways , while 31% intend to travel with their pet six or more times across the year.
Over half of owners plan to travel this year with their animal companions.
37% of owners have opted against travelling to stay at home with their dog.
78% of owners and their four-legged friends are driving and flying together more now than ever before.
37% of families travel with their furry friends. This is a 19% increase over the last decade.
Quick Links: Navigate Our Topics
How many people travel with dogs & other pets, where are the best places to travel with pets, how often to people take their pets on vacation, what do people do with their pets while on vacation, how many dogs travel a year compared to other pets, what are the problems & limitations of pet travel, how do people travel with pets in a car, statistics on people who travel with pets.
Over 50% of owners intend to take their pets away with them this year.
In 9 out of 10 households , dogs are considered part of the family .
31.3% plan to take overnight trips with their pets six or more times a year.
37% of families travel with their four-legged friends. This is a 19% increase over the last decade.
42% of owners aged 55-64 take their four-legged friends with them travelling. This makes Baby Boomers more likely to do this than younger generations.
If they have to leave their pets at home, 25% of Boomers make homemade treats for their dogs to enjoy when they are away.
75% leave behind an article of clothing with their scent on it!
25% of women will take their dog on vacation, whereas just 14% of men will do the same.
Before we dive into the other facts and figures, let’s look at what percentage of Americans own dogs. In the US, 36% of households own a dog , so right away it looks as though pet travel will be an important factor in traveling for many. So how many Americans travel with their pets each year? A survey by the American Pet Products Association (APPA) found that 37% of animal owners travel with their pets every year. This is up by 19% over the last decade! Research also shows that 42% of 55-64-year-old owners take their pets with them making Baby Boomers more likely to bring furry friends on their travels than younger generations. Overall, these stats show that many people own pets, and many travelers look to take their pets along on dog-friendly holidays . Companies in the travel industry would do well to take notice of this trend.
Sources: Partners & Napier , Breedsy , Go Pet Friendly , Ozy
PET TRAVEL DESTINATION TRENDS
It’s estimated that 2 million pets board commercial flights in the US every year.
A study of dog owners in the UK showed that 85% would rather a staycation in the UK with their pets than a holiday abroad without them.
For those opting to take UK holidays with their dogs, the study found the South East to be the most pet-friendly area.
Behind the South East, the two next most friendly UK areas are the South West and the East of England. These areas have the most walks, vets, and dog-friendly pubs.
According to owners, 61% of dogs enjoy trips to the US. This is followed by Canada and the UK.
18.3% of owners showed interest in visiting a historic site or national park with their pets.
12.5% want a holiday where they can stay at a hotel in a pet-friendly city.
42.9% of pet owners want a destination with hiking opportunities and fresh air.
An estimated 2 million pets board planes every year just in the US, so it’s certainly worth exploring where travellers like to go with their pets. A TripAdvisor study cited by Four Legged Travels showed that 61% of dogs enjoy trips to the US. This is followed by Canada and the UK. By surveying UK dog owners, Holiday Park company Away Resorts found that 85% would prefer a staycation with their dogs than to leave them behind and go abroad. It looks as though owners are willing to make sacrifices to vacation with their furry friends. For those travelling in the UK, the most pet-friendly destinations are the South East, South West and East of England. This is based on pet-friendly pubs, the number of walks, and the number of vets, so you can be sure that you’ll find everything your four-legged friend needs in these places.
Sources : Travel & Leisure , Tourism Show , Go Pet-friendly
PET & DOG VACATION STATISTICS: FREQUENCY
Just 4.6% of owners are not planning to take any overnight trips with their pets.
15.4% of owners enjoy dog-friendly beach holidays the most.
27.5% of owners plan to take one to two pet-friendly overnight trips.
36.7% are planning 3 to 5 overnight stays with their pets.
31.3% intend to go on overnight trips with their pets six or more times during the year.
Out of dog owners that travel for Christmas holidays, 5/6 dogs will go along too.
We know travelling with dogs and other pets is something that owners value, but how frequently do people take vacations with their pets? Go Pet Friendly’s survey found that a considerable 36.7% are planning three to five overnight trips with their pets, while 31.3% intend on six or more! On the other end of the scale, just 4.6% of owners state that they are not planning any overnight trips with their pets. It seems that most owners don’t want to leave their pets out if they can avoid it. This doesn’t change at Christmas either! Pet product company Kurgo found that five in six dogs join owners travelling during the Christmas holiday period.
Sources : Go Pet Friendly, Kurgo
PET TRAVEL STATISTICS: LEAVING PETS WHILE ON VACATION
37.5% of surveyed owners said they won’t travel without their pets.
20% have previously phoned home to “speak” to their pet while away.
4% of owners say they have gone as far as to send their pet a postcard while they’re away.
While away, almost a quarter of owners carry a picture of their cat or dog and almost as many will come back with a souvenir for their pet.
15% arrange special play dates with other dogs while they’re away.
The same number of owners also plan video calls with their pets when they’re away.
3% of owners have even left an over-sized photo of themselves for their dog when they’re away from home
Just 7.1% of those asked don’t have concerns about travelling without their pets.
14.2% say that their biggest concern is that their pets will miss them or won’t understand where they’ve gone.
20.8% of surveyed owners worry that the care received by their pets while they’re away won’t match the quality of care at home.
7.1% worried that their pet will get lost or sick while they are away.
13.3% said they would miss their pets too much or feel too guilty to properly enjoy their break.
Sadly, there are times when our dogs, cats and other animals must be left behind. It’s not always clear what to do with pets when you're away without them, and it seems owners try all sorts of things to help with these situations. 37.5% of owners don’t see this as an option at all, and simply won’t go on vacation without their pets, according to the Go Pet Friendly survey. One fifth said that they’ve previously phoned home while they are away, and 15% arrange video calls to check on their pets. 4% have previously gone as far as to send a postcard home for their pet! Some of the biggest concerns owners have when travelling without their pets are that they worry that the care they receive won’t match the quality of care they usually have, and secondly, owners worry that they will be missed and pets won’t understand why they are not there.
Sources : Go Pet Friendly , PBS Pet Travel , Travel Agent Central
PET TRAVEL TRENDS: TYPE OF PETS TRAVELLING
The most popular travelling pets are dogs , and they make up 58% of pets travelling worldwide.
Cats come in second place, making up 22% of all pet journeys yearly.
Pet birds rank as the third most popular, ahead of horses, and small mammals.
With dog’s making up 58% of the pets travelling worldwide, they’re the most commonly travelled-with pets. Cats are the second most popular and account for 22% of pet journeys while, somewhat surprisingly, pet birds take third place.
Sources : PBS Pet Travel
PET TRAVEL TRENDS – LIMITATIONS OF PET TRAVEL
80% of leisure travellers with dogs think pet-friendly policies such as dog-friendly beaches and pubs , are important, whereas only 5.7% find them to be unimportant.
20% of those who go on vacation with pets admit to having smuggled their pet into a hotel room.
35% of owners take shorter vacations due to having pets.
A quarter of owners take fewer holidays overall as a result of having pets.
7% of pet owners admit to having dressed their pets as service animals when they are really just regular pets in order to vacation together.
80% of travellers with dogs find pet-friendly policies to be important, so non-pet-friendly destinations and accommodations may not be viable for pet owners. This means that people are at times limited when travelling with pets. According to a TripAdvisor report cited by Skift, 35% of owners take shorter vacations because they have pets, and 25% of owners take fewer holidays overall for the same reason. It seems that regardless of whether the pet is to join them or not, they can limit the choices and freedom of their owners. However, some owners will try everything they can to avoid these limitations. According to Travel Agent Central, 7% of owners have disguised their pets as service dogs for ease of travel, while Skift reports that a fifth of travellers has smuggled their pet into a hotel room!
Sources : Statista , Travel Agent Central , Skift
PET TRAVEL STATISTICS - CAR TRAVEL
A considerable 54.6% of surveyed people said their pet joins them in the car more than six times a month.
56% of respondents have driven with their dog inside the vehicle at least monthly over the last year.
For dog owners, the most common activity engaged in while driving is petting the dog (52%).
Only 0.8% of respondents said they never drive with their pets in the vehicle.
6.7% said their pets accompany their owners in vehicles with them under once a month.
12.5% said pets join their owners in a vehicle with them about once a month.
25.4% said they travel with a pet in the vehicle two to five times per month.
According to the Go Pet Friendly survey, a huge 54.6% of people said that their pet rides in the car with them more than 6 times a month, while the Kurgo survey found that 56% of respondents said pets ride in the car at least once a month. Less than 1% said that they never drive with their pet in the vehicle, travelling this way with pets doesn’t appear to be an issue for many people. Secure carriers, safety harnesses, and pet barriers allow for safe transport for pets in cars. This form of pet travel is likely very popular for staycations and holidays a shorter distance from home.
Sources : Kurgo , Go Pet Friendly
- Terms & Conditions
- Privacy Policy
- Modern Slavery Act
- Travel & Tourism Statistics
- Frequent Traveller Club
- Travel Trade
- Condor in the Community
- Corporate Hub
- Jersey Holidays & Breaks
- Guernsey Holidays & Breaks
- Condor Breaks Booking Conditions
- Foreign Office Travel Advice

- Condor Ferries
- St. Peter Port
- +443456091024
Copyright © Condor Limited 2024. All rights reserved.
- Pet Industry Statistics
Report Highlights. Pets, pet products, and pet care are all part of a $103.6 billion national industry; 40.5% of revenue is from food and treats alone.
- The pet industry grows by 11.6% every year.
- The average pet-owning household spends $1,120 per year on their pets.
- 2-in-3 American households include at least one pet.
- Two (2) corporations consume 49% of the pet industry’s market share.
- Globally, the pet industry is worth $232 billion .

The pet industry is one of the most massive sectors of the American economy, with many more years of growth potential. While some markets may lag, statistics indicate that economic downturns do little damage to the industry as a whole.
- Americans are responsible for 44.7% of the global pet market.
- 67% of households nationwide keep pets.
- Over the last decade, domestic industry revenue has grown at an annual rate of 11.6%.
- The most profitable pet supply company is PetSmart, Inc. with a 34% market share.
- PETCO is the second-largest with a 15% market share.
- $23,400–$27,200 is the average lifetime cost of raising a pet.
- U.S. pet owners spend a collective $42.0 billion on pet food and treats annually.
- Pet care service sales, such as grooming and doggie day care, doubled over 10 years but declined 47% from March to September 2020 during COVID-19 quarantines.

- Technology in the Pet Industry
Online pet-related purchases lead eCommerce markets, and more users make first-time purchases every day. Tracking and identification technology is the fastest rising product type.
- 13% of pet-related sales are made online.
- Chewy.com is the leading pet specialty eTailer with $3.5 billion in annual sales, or
- 20% of pet owners who buy supplies online purchased from Chewy in the last year.
- Amazon and its third-party retailers made 35% of online pet sales.
- Technology is a growth market, seeing a 14% increase in sales each year.
- $1.6 billion is the market share for pet-related technology.
- Pet Food Industry Statistics
The largest sub-market in the industry, pet food sales account for 39.3% of the global market. Owners drive the industry, demanding higher quality products and more accountability among pet food manufacturers and suppliers.
- Over 500 pet food manufacturers produce the 3.3 billion pounds of pet food American dogs and cats consume annually.
- 2 pounds of food per month is the average companion animal’s rate of consumption.
- 55% of consumers buy their pet’s food from pet supply stores.
- 85% of consumers think pet food companies aren’t as transparent as they should be about ingredients and their sources.
- 44% of pet owners say buying healthy food for their pet is more of a priority than buying healthy food for themselves.
- 53% of pet owners take just as much care to purchase healthy food for their pet as they do for themselves.
- 21% of pet food sales are treats.
- Pet owners spend 4 times as much on food and treats as they do on general pet supplies.
- Mars Petcare Inc., the largest pet food corporation, is worth more than $18 billion.
- The success rate of pet food companies has created a boom in trendy boutique and specialty pet food products.
- The U.S. exports $1.5 billion worth of pet food each year, more than any other world nation.
- U.S. pet food exports to China increased 88% in a year, from 2018 to 2019.
- Thailand imports more pet food than any other world nation.
- The East Asian pet food market is worth $11 billion.

- Pet Healthcare Industry Statistics
Growth in the pet healthcare industry outpaces that of human healthcare. Pet healthcare includes veterinary services, pharmaceuticals, over-the-counter medications, behavioral therapies, calming therapies, spa treatments, vitamins, allergy treatments, and more.
- The U.S. pet healthcare industry makes up about 33% of the global market.
- It serves as many as 10 billion companion animals worldwide.
- Pet healthcare is a 10 billion dollar industry, and its total economic impact is estimated to be $54.8 billion
- 19,400 jobs with $1.1 billion in wages are included in that economic impact.
- 5% is the annual growth rate of the pet healthcare industry.
- 1% of the U.S. pharmaceutical market goes to pet healthcare.
- After pharmaceuticals, flea and tick medications are the second-most common expenditures.
- 29% of the market is flea and tick medications
- Pet owners spend an average of $81 on tick and flea medication for each pet.
- Toward the end of a pet’s life, its owner’s healthcare expenditures skyrocket.
- High-income pet owners spend over three times as much of their household’s budget on their pet’s health care than low-income owners do.
- Animal health manufacturers spend more than twice as much on research and development as they do on manufacturing costs.
- The U.S. exports $2.5 billion worth of pet healthcare products.
- 10% of pet medications are imported.
- Imports are worth $1 billion, giving the United States a $1.5 billion trade surplus in the pet healthcare industry.
- The industry provides federal and state governments with $38.1 million in taxes.
- The indirect economic impact, which includes jobs in related industries and industries that depend on pet healthcare, may be as high as $548 billion.
- Veterinary Industry Statistics
Most pet healthcare expenses go to veterinary services. Vet techs perform many of the same duties that nurses do in a regular doctor’s office and are similarly in demand. Job growth within the industry is projected to continue.
- 27% of all pet-related expenditures are for vet care.
- The average annual vet bill ranges from $100 for birds to $260 for dogs and $550 for horses.
- Routine physicals and vaccinations are the most commonly performed services.
- Surgical expenses have the heftiest price tag, followed by emergency visits.
- Pet owners pay a collective $30.2 billion in veterinary bills each year.
- 60% of veterinary workers are vet techs, veterinarians, or animal caretakers and lab assistants.
- There are more veterinarians nationwide than there are medical doctors.
- 10% of pet owners purchase their pet’s food from their veterinarian.
- 44% of pet owners say their veterinarian is their main source of nutrition information (compared to 25% of pet owners who cited the internet as their primary source for pet nutrition information).

- Pet Insurance Industry Statistics
Pet insurance is still not as popular among American pet owners as it is elsewhere in the world. It is, however, one of the fastest-growing sub-markets within the national and global pet industries.
- The pet insurance industry launched in 1982 when Veterinary Pet Insurance (now part of Nationwide) became the first pet insurance company.
- Pet insurance is growing by as much as 16.8% each year.
- With just 2.1 million or 1.6% of pets covered, the pet insurance industry is still in its infancy.
- Premiums average $140 for cats and $190 for dogs.
- High-end rates are $340 for cats and $540 for dogs.
- Premium rates grew by 23.2% in five years.
- 81% of pet insurance policies are combined accident and illness coverage for dogs.
- 15% of pet insurance policies cover cats and other pets.
- While most companies only cover dogs and cats, some offer policies for rabbits, birds, reptiles, and pot-bellied pigs.
- 250 U.S. companies include pet insurance in 80,000 employee benefit packages.
- In Sweden, over 30% of pets are insured.
- Canada’s pet insurance industry nearly doubled its profits in five years, from $91 million to $161 million.
- The most common claim among insured pets is for non-specific GI illnesses.
- Cancer and unspecified lameness (limping) are the second- and third-most common claims, respectively.
- 1-in-3 pets need unexpected veterinary care each year.
- $800-$1,500 is the average cost of emergency vet care.

- Pet Care Service Industry
Pet-sitting, boarding, and grooming are crucial services for many pet owners. Grooming may be essential for a pet’s health and well-being, and high-income earners are willing to pay for luxury.
- 8% of the pet industry is made up of grooming and boarding services alone.
- The industry has grown more than 60% since 2007.
- 42% of the pet care service industry is composed of grooming services.
- 18,700 people work just in grooming and/or boarding services.
- Pet-sitting/walking is the least lucrative pet care service.
- Animal training services are some of the most lucrative sectors and account for 10% of the pet care service industry.
- Animal trainers and businesses each earn an average of $373,000 annually.
- Just under half of all pet care service workers are self-employed.
- Excluding self-employed workers, 111,384 employees populate the pet care service industry.
- Pet care service jobs have grown exponentially in the past decades, outpacing job growth in every other pet industry.
- Most pet care workers are employed by companies with fewer than 20 people.
- Over 100,000 companies are active in this market.
- 30% of pet grooming expenditures go toward supplies.
- Most grooming expenses go toward shampoos and conditioners.
- A steady 4.3% annual growth rate in pet grooming and boarding services appears to have stalled.
- Some experts say the market will see a 47% drop for the 2020 fiscal year.
- Illegal and Black Market Industries
The puppy mill and exotic pet industries are two of the most active pet-related black markets. While the general public grows more informed, most people still aren’t aware of how much puppy mills supply the greater pet industry. Characterized by filth and disease, most active puppy mills are illegal operations, with many advertising themselves as “breeders.”
- 90% of puppies sold in stores come from mills.
- Over 4 million puppies are born in mills every year.
- About half of them survive long enough to make it into pet stores.
- Only about 30% of puppy mills are licensed.
- 70% of pets are purchased from a breeder or pet store.
- In addition to federal bans on certain exotic pets, more than half of U.S. states have banned exotic pets either in full or in part.
- Exotic pets require specialized care, including a veterinarian who is familiar with the animal, a suitable habitat, and foods that may not be available in pet stores.
- Smugglers traveling with illegal animals will not prioritize the animal’s health or comfort.
- How Owners Drive the Pet Industry
Products may be manufactured for pets, but they’re marketed to pet owners . Owner demographics and spending habits drive the market. Younger pet owners, for example, are more likely to buy pet supplies online.
- After dog- and cat-owning households, households with freshwater fish were the third-most common, followed by bird-owning households.
- While more households include at least one dog, more cats than dogs are kept as pets, with cat owners averaging 1.8 cats per household.
- Dog-owning households keep an average of 1.6 dogs.
- Freshwater fish owners average 13 fish per household.
- 42% of all pets are freshwater fish.
- 35% of pet owners are under 40, making them the leading pet-owning age demographic.
- 80% of these under-40 pet owners own dogs.
- Less than 50% own cats.
- 81% of dog owners buy their dog a Christmas present.
- 21% of holiday pet sales are purchased by friends and family of pet owners.
- 36% of dog owners give their dog a birthday present.
- High-income pet owners spend as much as 60% of pet expenses on pet accessories, such as costumes, furniture, and even doggy cologne.
- 27% of pet owners have paid for professional photos of their pets.
- Over 135 million cats and dogs live in the United States.
- 200-300 million animals are kept as pets.
- Pet ownership rates increase with household income.
- Among households with a combined income of more than $80,000, 60% include pets.
- Among households with a combined income of less than $20,000, 36% include pets.
- 60% of people who lived in homes with four or more bedrooms own pets.
- 18% of people who live in homes with no bedrooms, such as studios or lofts, own pets.
- People who live in rural areas are 43% more likely to own pets than urban dwellers.
- Cat ownership in China increased 131% in four years, from 2015 to 2019.
- During that same period, cat ownership increased 102% in Korea and 53% in Taiwan.
- Pet Industry Market Size & Ownership Statistics
- Pet Industry Trends, Growth & Statistics in 2021 and Beyond: Unleashing Your Ecommerce Pet Marketing Strategies
- U.S. Census Bureau, Historical Household Tables
- American Veterinary Medical Association, U.S. Pet Ownership Statistics
- Pet Care Industry Analysis 2020 – Cost & Trends
- 10 Ridiculous Pet Products We Can’t Believe Really Exist
- Cats or Dogs: Which is More Expensive?
- A Guide to Worldwide Pet Ownership
- A Policy for Fluffy: Pet Insurance is a Small Industry–But It’s Poised for Big Growth in the U.S.
- Despite Pet Industry’s Strengths, Expected Decline in Sales for 2020
- Pet Grooming and Boarding – 2020 U.S. Market Research Report with Updated COVID-19 Forecasts
- Animal Health Institute: The Animal Health Industry
- Human and Pet Health-Cost Trends are Strikingly Similar
- Is American Pet Health Care (Also) Uniquely Inefficient?
- Census, Spending on Pet Care Services Doubled in the Last Decade
- Unique Opportunities for Increased U.S. Exports of Pet Food to East Asia Remain Despite COVID-19
- American Feed Industry Association, About the Industry
- Survey Examined Dog Owners’ Pet Food Beliefs
- Top Pet Food Companies Current Data
- Pet Franchise Industry Overview
- Facts + Statistics – Pet Statistics
- CNBC, Are You Prepared for a Vet Emergency? Most Americans Are Not
- Grandview Research, Pet Wearable Market Size, Share & Trends Analysis Report By Technology (RFID, GPS, Sensors), By Application (Identification & Tracking, Medical Diagnosis & Treatment), By Region, And Segment Forecasts, 2020 – 2027
- Allied Market Research, Pet Grooming Products Market by Type (Shampoo & Conditioner, Comb & Brush, Clippers & Scissors, and Others) and Distribution Channel (Retail Store, Online Platform, Supermarket/Hypermarket, and Others): Global Opportunity Analysis and Industry Forecast, 2018 – 2025

- Mission & Vision
- Board of Directors
- APPA Gives Back
- Industry Trends and Stats
- Pet Industry Data Insights (NPOS)
- Order Instructions for the APPA Store
- NPOS Data Portal
Total U.S. Pet Industry Expenditures
Actual sales within the u.s. market in 2023.
Pet Food & Treats $64.4 billion
Supplies, Live Animals & OTC Medicine $32 billion
Vet Care & Product Sales $38.3 billion
Other Services $12.3 billion
(Other Services include boarding, grooming, insurance, training, pet sitting and walking and all services outside of veterinary care)
Projected Sales within the U.S. Market in 2024
Pet Food & Treats $66.9 billion
Vet Care & Product Sales $39.1 billion
Other Services $12.6 billion
Source information:
- Pet Food & Treats: Source: Nielsen Scan: Nielsen IQ Scan – 52 Weeks ending 12/31/2022 for xAOC and Total Pet Retail. E-commerce pet food sales data powered by NielsenIQ Ecommerce Measurement. Pet food sales for 2022 in Vet clinics, Farm & Feed, Direct-to-Consumer, and Costco were estimated using industry/financial reports and any available data for either of these channels.
- Pet Supplies Live Animals & OTC Medicine: Pet Supplies and OTC Meds are based on data provided by Nielsen Scan, Rakutan Intelligence and Packaged Facts. Live Animals includes fish, birds, small animals and reptiles and is based on APPA estimates and data provided by leading retailers and industry suppliers.
- Vet Care & Product Sales: Includes routine veterinary care, surgical procedures and sales of pharmaceuticals and other products through veterinary clinics and is based on data provided by AVMA and Packaged Facts. Excludes food and treat sales.
- Other Services: Includes grooming, training, boarding, insurance, Pet sitting/walking and all services outside of Vet Care and is based on data provided by Packaged Facts as well as leading industry retailers.
All data was reviewed and validated by industry experts and leading pet retailers and manufacturers.
2023-2024 APPA National Pet Owners Survey Statistics: Pet Ownership & Annual Expenses
According to the 2023-2024 APPA National Pet Owners Survey , 66% of U.S. households own a pet , which equates to 86.9 million households.
Average Amount Spent on Common Pet Categories in the Past 12 Months
US Travel Header Utility Menu
- Future of Travel Mobility
- Travel Action Network
- Commission on Seamless & Secure Travel
- Travel Works
- Journey to Clean
Header Utility Social Links
- Follow us on FOLLOW US
- Follow us on Twitter
- Follow us on LinkedIn
- Follow us on Instagram
- Follow us on Facebook
User account menu
The latest travel data.
MONTHLY INSIGHTS March 04, 2024

U.S. Travel has temporarily paused our monthly data newsletter, however, the latest travel data is still available via the U.S. Travel Insights Dashboard . This dashboard is updated each month (member login required).
The U.S. Travel Insights Dashboard , developed in collaboration with Tourism Economics, is supported by more than 20 data sources. The dashboard is the most comprehensive and centralized source for high-frequency intelligence on the U.S. travel industry, tracking industry performance, travel volumes and predictive indicators of recovery including air and lodging forecasts, DMO website traffic, convention and group trends, travel spending and losses, traveler sentiment, among others to measure the health of the industry.
Key Highlights January 2024:
- Travel appetite started the year on a softer note, but overall growth continued. Air passenger growth remained positive, up 6% versus the prior year but lower than the double-digit growth seen through 2023. Foreign visits remained strong, up 24% YoY.
- Hotel room demand continued a trend of slight contraction falling 1% versus the prior year, while short-term rental demand grew 1%, a lower rate than 2023.
- A particular bright spot was that group room demand within the top 25 markets displayed solid growth of 9% relative to the prior year.
- The outlook for the economy remains fairly optimistic due to the strength of the labor market, looser financial conditions and healthy household and nonfinancial corporate balance sheets. This has filtered through to slightly higher consumer sentiment in February.
- Sentiment is also growing for upcoming leisure travel in 2024. The share of travelers reporting having travel plans within the next six months increased to 93% in January from 92% in December, according to Longwoods International’s monthly survey.
- Travel price inflation (TPI) fell slightly in January as a result of falling transportation prices. Sticky services inflation should see relief from decelerating wage growth. However, upside risks stem from rising healthcare costs, supply chain disruptions and slowing labor supply. Source: U.S. Travel Association and Tourism Economics
Member Price:
Non-Member Price: Become a member to access.
ADDITIONAL RESEARCH
Travel Price Index
Travel Forecast
Quarterly Consumer Insights
Additional monthly insights are available through the full U.S. Travel Monthly Data Report, exclusive to members. Please inquire with membership if you are interested in learning about becoming a member of U.S. Travel Association.
Visitor Statistics and Profiles
The Division of Tourism’s domestic sales and marketing programs are guided by a solid research foundation. Through careful consideration of combined proprietary research conducted by its vendors, and studies conducted by the tourism and vertical consumer brand marketing industries, the Division of Tourism makes fact-based decisions for all sales and marketing programs.
View and download period-spanning statistics on travel impacts and visitors:

Rural Visitors Profile (Calendar Year 2018-2022)

Cowboy Country Territory (Calendar Year 2018-2022)

Las Vegas Territory (Calendar Year 2018-2022)

Nevada Silver Trails Territory (Calendar Year 2018-2022)

Pony Express Territory (Calendar Year 2018-2022)

Reno-Tahoe Territory (Calendar Year 2018-2022)

Heartworm Incidence Maps
Tracking the Impact of Heartworm Disease Every three years, the American Heartworm Society (AHS) gathers data on heartworm testing to understand the impact heartworm is having nationwide, as well as in specific regions. Testing data from thousands of veterinary practices and shelters is used to create a detailed map showing the average number of heartworm-positive cases per clinic.
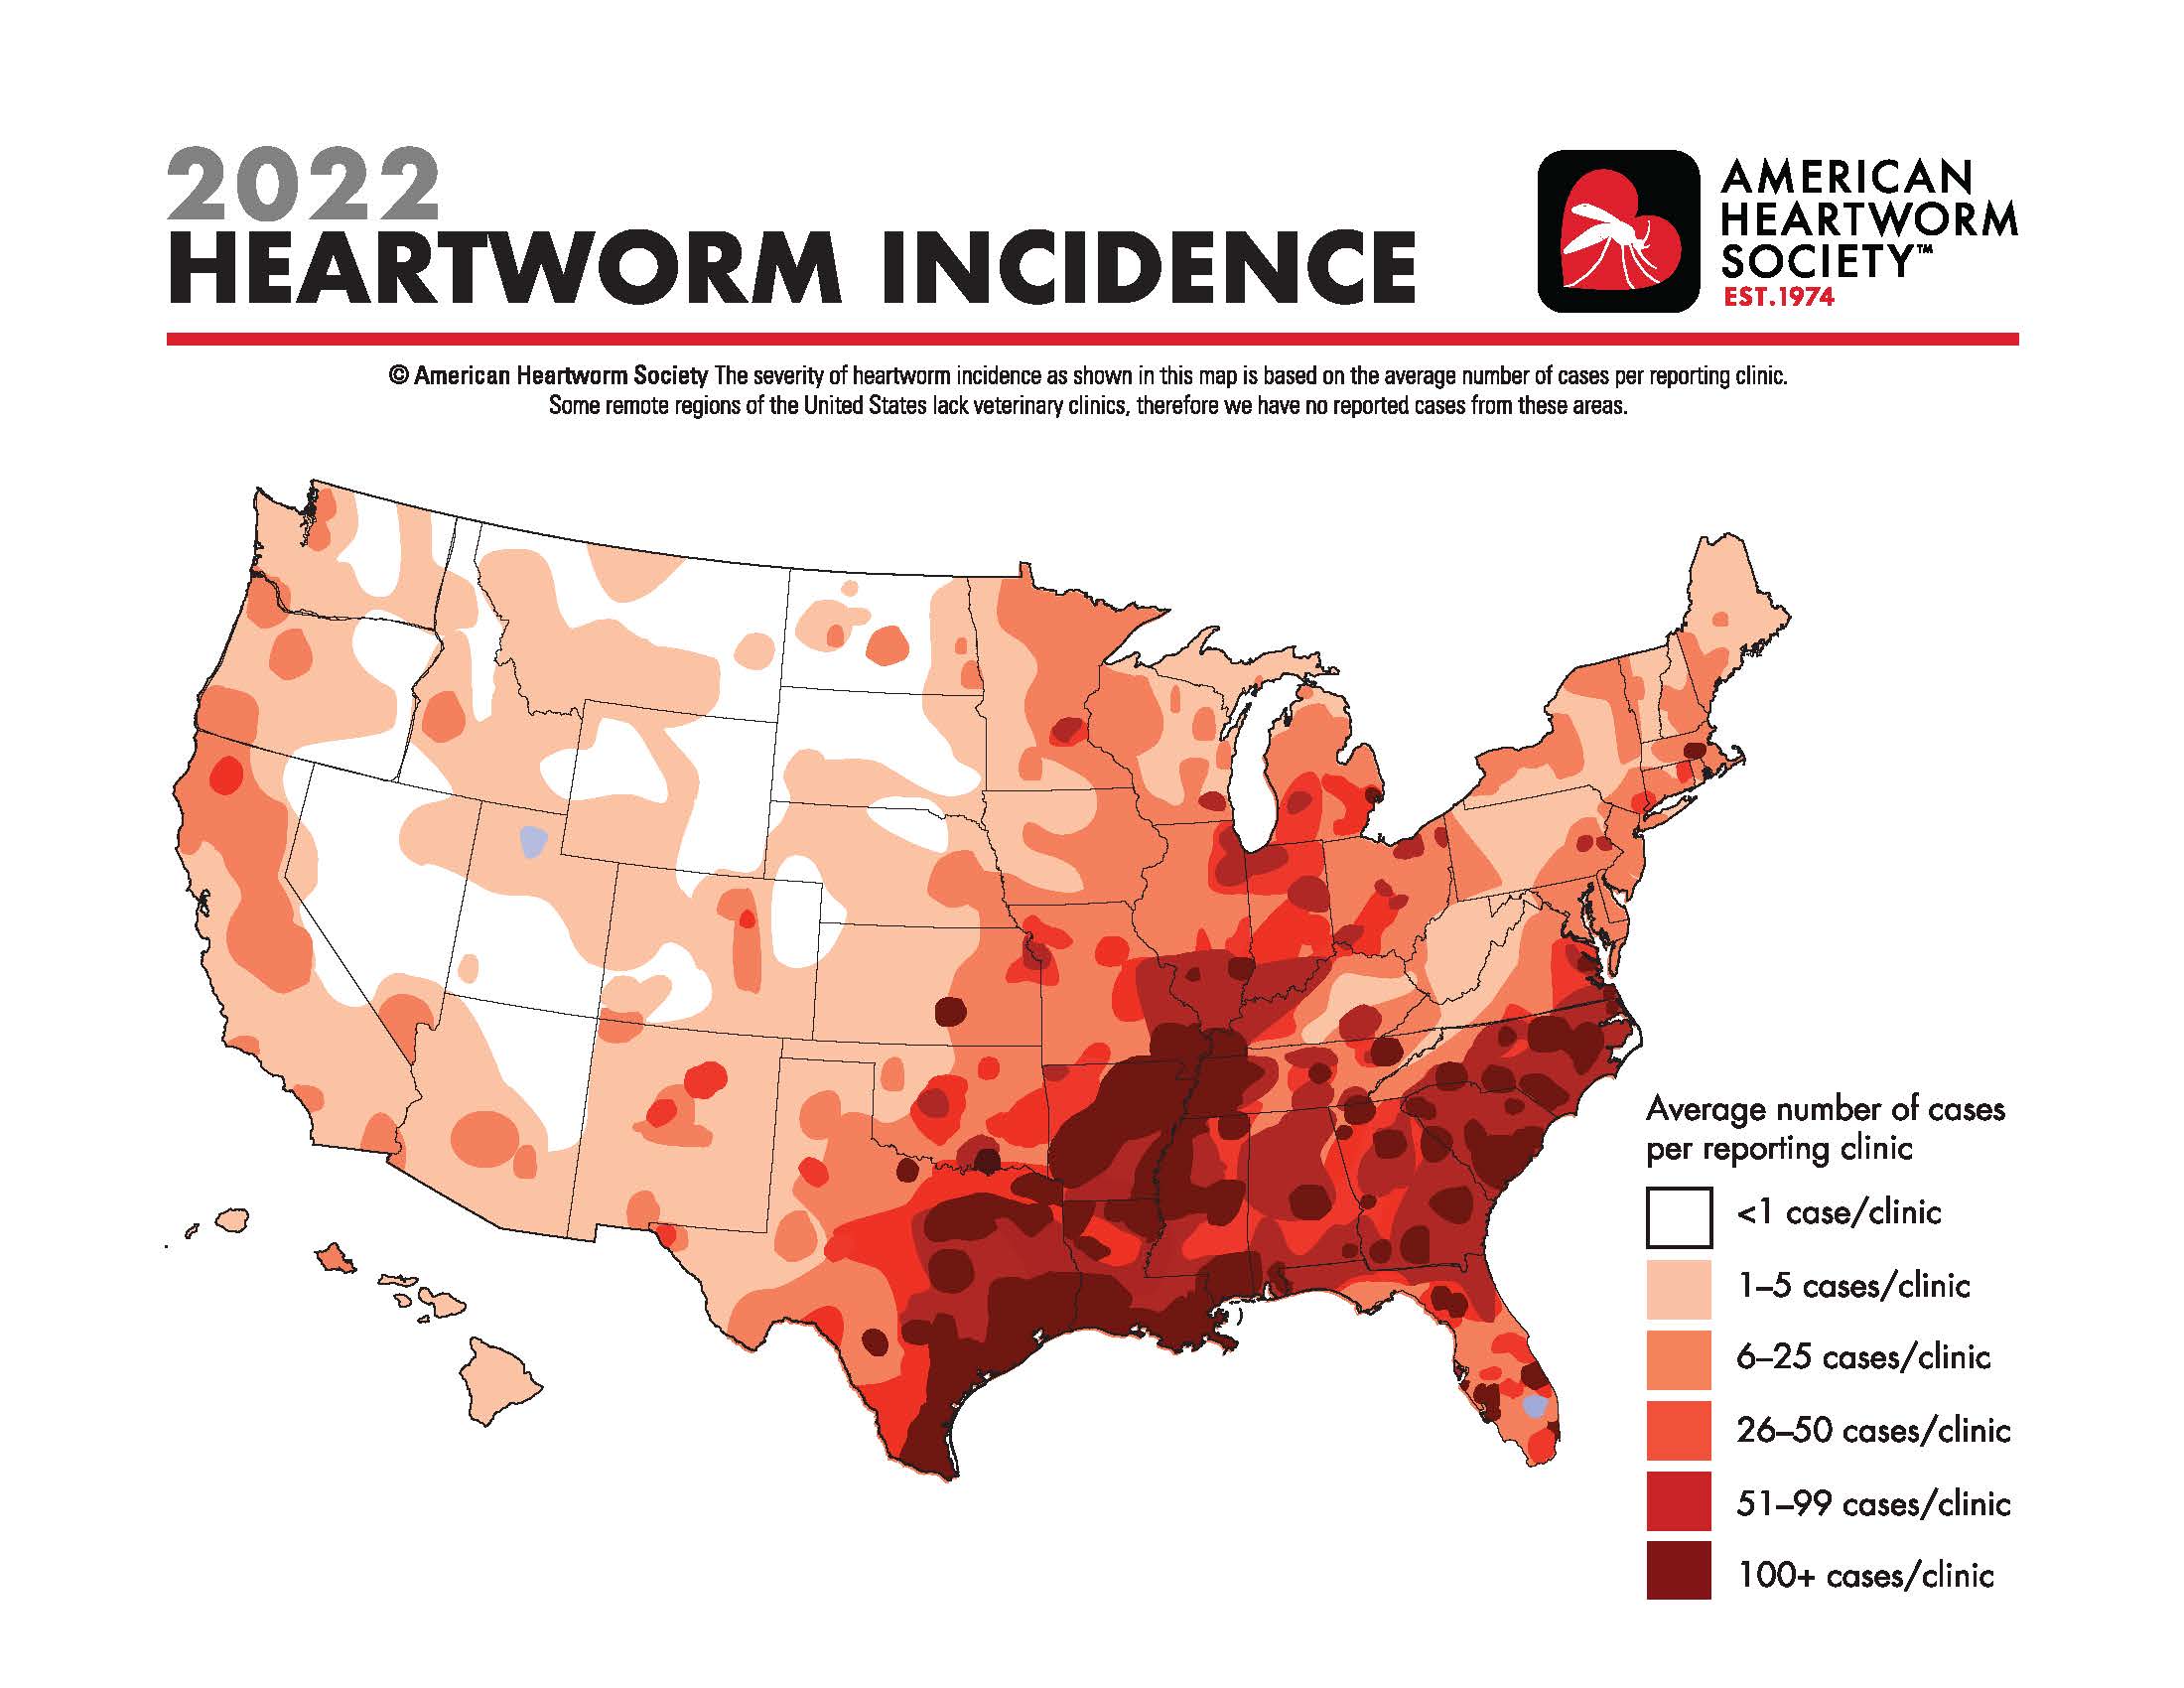
Incidence Map 2022
Incidence Map 2022 (Spanish)

Incidence Map 2019

Incidence Map 2019 (Spanish)
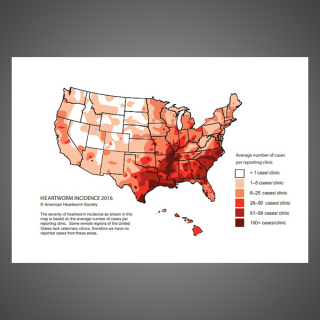
Incidence Map 2016

Incidence Map 2013
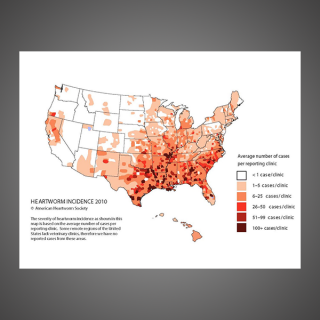
Incidence Map 2010
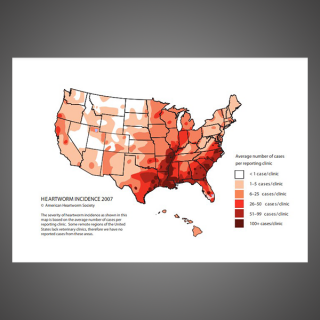
Incidence Map 2007
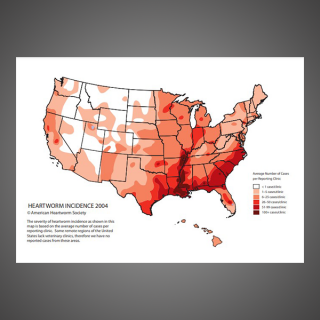
Incidence Map 2004
Incidence Map 2001
Changes in heartworm incidence over time.
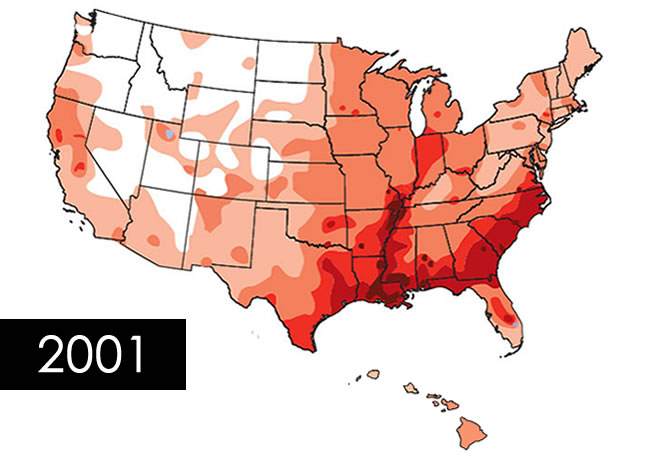
The days are getting shorter, the nights are cooler, leaves are starting to turn, and football season is here. But that doesn’t mean your clients can forget about protecting their pets from heartworms.
To keep this message front and center with your clients, we’re sharing a set of new posters you can print OR post on your Facebook or Instagram page.
- To save or print a poster , just click on the image below, then click on the “download” button and save the PDF file.
- To save a poster for use on your social pages , simply open the downloaded poster, then right click on the file and follow the menu instructions to save the file as a JPEG image.

Heartworm Tall Tales - Season

Heartworm Tall Tales - Cost
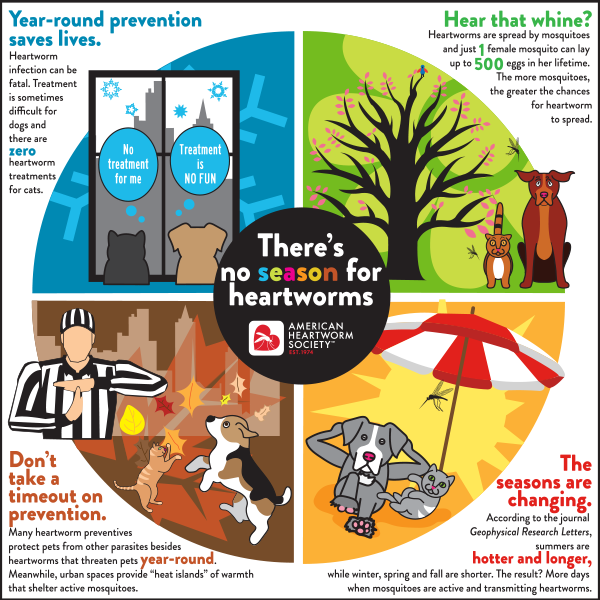
There's No Season for Heartworms

Think 12 Series: There's no such thing as a heartworm free zone. (Winter)

Don't "fall" back on heartworm protection in the fall

Dogs need fall heartworm protection
For more client tools, be sure to visit the Resource Center . And if you don’t already, make sure you’re sharing our Facebook and Instagram posts!
- Our Mission
- Our Leadership
- Our Sponsors
- Support AHS
- AHS Bulletin Archive
- Member Logo
- Proceedings Archive
- Heartworm Guidelines
- COVID-19 Recommendations
- AHS Bulletin
- Preventive Drug Chart
- Triennial Symposium
- AHS Board Speaks Out
- Resistance Statement
- Heartworm University
- Relocating Heartworm Positive Dogs
- Treatment Dosage Calculator
- Incidence Maps
- Heartworm Images
- Heartworm Life Cycle
- Social Media Tools
- Heartworm Preventive Waiver
- Think 12 Resources
- Heartworm Treatment Handout
- Decision-Making Considerations
- Shelter Educational Brochures
- Order Materials
- Heartworm Basics
- Video Gallery
- Infographics
- Just for Kids
- Heartworm Medicine for Dogs
- Heartworm Prevention for Dogs
- Heartworm in Cats
- Resource Center

IMAGES
VIDEO
COMMENTS
The Growing Interest in Pet Travel 1. 70% of US households own at least one pet. (APPA) From 1988 to 2022, pet ownership increased substantially, growing by 14%. In the past 3 years alone, pet households grew by 3%. In 2022, 70% of US households own a pet, which is around 90.5 million families.
Today, we've rounded up the latest statistics on pet travel for you. Here we go! Sources: You can see the source for each statistic under the entry, ... From 1988 to 2022, pet ownership continued to grow by 14% in the US, until approximately 90.5 million families owned a pet in the US in 2022. 4. In 2023, the top country in terms of pet ...
About 75% of luxury, mid-scale, and economy hotels allow pets. In 2019, a total of 404,556 animals were transported by airline. Nearly 64% of travelers prefer to travel with pets by car. 9% of ...
78% of American pet owners travel with their pets every year. 53% of pet owners take their pets when traveling. Females are more likely to bring their dogs on vacations compared to males. Dogs make up 58% of transported pets worldwide. 63.8% of pet owners prefer to travel with their pets by car or pick-up.
You can set yourself and your pet up for success in 2022 by: Starting the relocation planning process 3-6 months in advance. Reading up on the requirements in your destination country. Understanding that aligning your pet's travel timeline with your own may not be possible—especially if you're moving on a tight timeline or to a far away ...
The global pet travel services market size is estimated at USD 1.96 billion in 2023 and is expected to grow at a compound annual growth rate (CAGR) of 9.69% from 2024 to 2030. Market growth is propelled by factors such as increasing pet adoption rates & humanization trends, rising number of tourists traveling along with their companion animals ...
According to the 2021-2022 APPA National Pet Owners Survey, a resounding 70% of U.S. households own a pet. Of the 90.5 million homes filled with animals, approximately 78% of these American pet owners travel with their companions each year. The most popular of all species to travel alongside their human counterparts are canines and felines.
The pet travel services market size crossed USD 1.8 billion in 2023 and is projected to witness 9.5% CAGR from 2024 to 2032, driven by the growing awareness of pet well-being, coupled with a rise in disposable income, increasing adoption of pet insurance, and a shift towards a pet-centric lifestyle.
The 2022 pet ownership statistics also revealed that cats and dogs are the most popular of all species to travel alongside their human counterparts! In this monthly series, we highlight the top five domestic and international destinations dogs and cats traveled to with GlobalVetLink pet health certificates .
COVID-19 & inflation impact 8 Premium Statistic How COVID-19 affected pet ownership in the U.S. 2020-2022 Premium Statistic New pet ownership due to COVID-19 in the U.S. 2020/21, by generation
In addition, the 2021-2022 APPA National Pet Owners Survey contains a lifestyle and media study, which examines what motivates pet ownership and relationships with pets, along with habits such as internet usage, travel, work and other demographic criteria. A total of 9,206 pet owners are included in the 2021-2022 National Pet Owners Survey.
Small dogs remain the most popular size - 47% of dog owners have small dogs. Unless otherwise noted, the statistics quoted were reported in APPA's 2021-2022 National Pet Owners Survey, which ...
In 9 out of 10 households, dogs are considered part of the family. 31.3% plan to take overnight trips with their pets six or more times a year. 37% of families travel with their four-legged friends. This is a 19% increase over the last decade. 42% of owners aged 55-64 take their four-legged friends with them travelling.
have been dealing with hikes in gas prices, airfares, and travel costs, new and used vehicles, and the strain of paying more money for just about any necessity. Getting squeezed every which ... Q2 2022 Pet Trends Report Share of US total sales - in-store vs. online Total US online sales May 2022 $26.6B In-store Online 90% 76.3%
Cori Stoutenberg. [email protected]. 203-532-3647. "The latest Strategic Insights presentation from APPA is outstanding! It is a great collection of industry data points and specific research findings. The easy-to-follow format made it quick to identify opportunity areas for our business.
Find out if your pet qualifies to travel. Your animal doesn't qualify for pet travel and is subject to different import regulations and export regulations if you: Don't see your pet listed below. Are exporting semen or embryos from any animal. Have a pet that's considered livestock or poultry, like pigs or chickens.
Pet Industry Statistics. Report Highlights. Pets, pet products, and pet care are all part of a $103.6 billion national industry; 40.5% of revenue is from food and treats alone. The pet industry grows by 11.6% every year. The average pet-owning household spends $1,120 per year on their pets. 2-in-3 American households include at least one pet.
Source information: Pet Food & Treats: Source: Nielsen Scan: Nielsen IQ Scan - 52 Weeks ending 12/31/2022 for xAOC and Total Pet Retail.E-commerce pet food sales data powered by NielsenIQ Ecommerce Measurement. Pet food sales for 2022 in Vet clinics, Farm & Feed, Direct-to-Consumer, and Costco were estimated using industry/financial reports and any available data for either of these channels.
Spending on pets is up, mirroring increases in pet ownership and pet insurance sales: Americans spent $136.8 billion on their pets in 2022, up 10.68% from 2021 ($123.6 billion). [1]
Sentiment is also growing for upcoming leisure travel in 2024. The share of travelers reporting having travel plans within the next six months increased to 93% in January from 92% in December, according to Longwoods International's monthly survey. Travel price inflation (TPI) fell slightly in January as a result of falling transportation prices.
View and download period-spanning statistics on travel impacts and visitors: Rural Visitors Profile (Calendar Year 2018-2022) View Download. Cowboy Country Territory (Calendar Year 2018-2022) View Download. Las Vegas Territory (Calendar Year 2018-2022) View Download. Nevada Silver Trails Territory (Calendar Year 2018-2022) View Download.
Heartworm Incidence Maps. Every three years, the American Heartworm Society (AHS) gathers data on heartworm testing to understand the impact heartworm is having nationwide, as well as in specific regions. Testing data from thousands of veterinary practices and shelters is used to create a detailed map showing the average number of heartworm ...
Pet owners' steep spending on pets has led industry-wide revenue to expand at a CAGR of 6% over the past five years, totaling an estimated $14.7 billion, including an expected 1.3% increase in ...
Washoe County. Reno. 89506. Stead. 11120 Gallaudet Dr. Zillow has 39 photos of this $545,000 4 beds, 2 baths, 2,187 Square Feet single family home located at 11120 Gallaudet Dr, Reno, NV 89506 built in 2022. MLS #240004924.