
6. Business travel
Select one of the buttons below to enter your scope 3 category 6 data. There are two options: Business travel & study abroad (distance traveled), and Purchasing data (dollars or MT eCO2).
Business Travel & Study Abroad (distance traveled) Air travel paid for by the institution is required for Second Nature signatories
Purchasing Data (USD)

What is business travel?

The business travel category includes emissions from transportation of employees for activities related to the organization. This only includes travel that does not take place in vehicles owned by the organization; travel in vehicles owned by the organization should be reported in scope 1. Examples include air travel, personal mileage reimbursement, and travel by train. Business travel is category 6 of scope 3.
Air travel and radiative forcing
Radiative forcing is associated with emissions at higher altitudes and results in a higher global warming effect. Air travel CO 2 emissions are multiplied by the radiative forcing factor to account for the higher global warming potential from emissions released at higher altitudes. The radiative forcing factor is also sometimes referred to as the radiative forcing index.
SIMAP accounts for radiative forcing for all air travel CO 2 emissions. Radiative forcing does not apply for CH 4 and N 2 O emissions. To calculate your total air travel emissions, SIMAP multiplies the radiative forcing factor by the air travel emissions factor (see the emissions factors page). The SIMAP calculation is as follows:
Passenger miles * air travel CO 2 emissions factor * radiative forcing factor
SIMAP has two options for the air travel radiative forcing factor: 2.7 (default, IPCC) and 1.9 (DEFRA). See the SIMAP guidance on air travel emissions for more information about radiative forcing.
What options are available in SIMAP for business travel data entry?
There are 2 data entry categories for business travel in SIMAP: Business travel & study abroad and Purchasing data.
- Directly financed air travel. Units: Passenger miles or US dollars.
- Ground travel: Charter buses. The types of buses in SIMAP are diesel, CNG, alternative fuel, and other. Units: vehicle miles.
- Ground travel: Personal mileage reimbursement. Units: Vehicle miles.
- Ground travel: Public bus. Units: Passenger miles.
- Ground travel: Train. Units: Passenger miles.
- Ground travel: Taxi / ferry / rental car. Units: Vehicle miles.
- Other: This source has no default emission factors and is intended to be customized.
- Study abroad air travel. Units: Passenger miles or US dollars.
- Purchasing data: Enter dollars spent on purchasing categories. You can assign any of the purchasing data categories to the business travel category. Note that purchasing data is intended to provide an order of magnitude estimate; enter more detailed activity data (e.g., weight of food) whenever possible. See this page for guidance on purchasing data entry .
GHG Protocol Corporate Value Chain (Scope 3) Accounting and Reporting Standard

- Get started
Scope 3 - Category 6: Business Travel
This covers emissions from the trips of employees for business reasons in transport options run by outside parties.

Interview multiple candidates
Lorem ipsum dolor sit amet, consectetur adipiscing elit proin mi pellentesque lorem turpis feugiat non sed sed sed aliquam lectus sodales gravida turpis maassa odio faucibus accumsan turpis nulla tellus purus ut cursus lorem in pellentesque risus turpis eget quam eu nunc sed diam.
Search for the right experience
Lorem ipsum dolor sit amet, consectetur adipiscing elit proin mi pellentesque lorem turpis feugiat non sed sed sed aliquam lectus sodales gravida turpis maassa odio.
- Lorem ipsum dolor sit amet, consectetur adipiscing elit.
- Porttitor nibh est vulputate vitae sem vitae.
- Netus vestibulum dignissim scelerisque vitae.
- Amet tellus nisl risus lorem vulputate velit eget.

Ask for past work examples & results
Lorem ipsum dolor sit amet, consectetur adipiscing elit consectetur in proin mattis enim posuere maecenas non magna mauris, feugiat montes, porttitor eget nulla id.
Vet candidates & ask for past references before hiring
Lorem ipsum dolor sit amet, consectetur adipiscing elit ut suspendisse convallis enim tincidunt nunc condimentum facilisi accumsan tempor donec dolor malesuada vestibulum in sed sed morbi accumsan tristique turpis vivamus non velit euismod.
“Lorem ipsum dolor sit amet, consectetur adipiscing elit nunc gravida purus urna, ipsum eu morbi in enim”
Once you hire them, give them access for all tools & resources for success
Business travel involves the transportation of employees for work-related activities. Most of these vehicles are not owned or controlled by the company that reports the emissions. These emissions are classified as scope 3, category 6 (Business travel). However, there are some exceptions to this rule. If the company owns or controls the vehicles, the emissions are either scope 1 (Fuel consumption) or scope 2 (Electricity usage for electric vehicles). If the company leases the vehicles and they don’t fit into scope 1 or 2, the emissions are scope 3, category 8 - Upstream leased assets. Moreover, the emissions from employees travelling to and from their workplace are not considered business travel, but scope 3, category 7 - Employee commuting.
Types of Emissions from Business Travel
Emissions from business travel activities can originate from various modes of transportation, including, air travel, rail travel, bus travel, automobile travel (this encompasses business travel in rental cars or employee-owned vehicles, excluding daily commutes), as well as, any unconventional modes of transportation associated with business activities.
In some cases, companies may choose to include emissions from business travellers staying in hotels as part of their scope 3 emissions. It's important to note that a company's scope 3 emissions from business travel also encompass scope 1 and scope 2 emissions generated by transportation providers, such as airlines.
Calculating Emissions from Business Travel
Selecting the right method for calculating emissions from business travel is crucial. Here's how to make the decision:
Choosing the right way to calculate business travel emissions is vital. Follow these steps:
First, ask: Is business travel a major source of scope 3 emissions or necessary for business goals? If yes, ask: "Do we have fuel consumption data?" If yes, use the fuel-based method. If not or if business travel isn't critical, ask: "Do we have distance data?" If yes, go with the distance-based method. If you lack both fuel and distance data, ask: "Do we have 'spend data' for business travel?" If yes, choose the spend-based method.
Fuel-Based Method
The fuel-based method is similar to the one used in Upstream transport and distribution. It involves determining the amount of fuel consumed during business travel (scope 1 and scope 2 emissions of transport providers) and applying the appropriate emission factor for that fuel. Companies can also collect data on the number of hotel nights incurred during business travel by hotel type, integrating this information with the fuel-based method.
Distance-Based Method
In cases where fuel data is unavailable, the distance-based method becomes the go-to choice. It involves multiplying activity data (i.e., vehicle-kilometres or person-kilometres travelled by vehicle type) by emission factors (typically default national emission factors by vehicle type). This includes all modes of transportation, such as aircraft, rail, subway, bus, and automobiles.
Companies need to collect data on:
- Total distance travelled by each mode of transport for employees in a given year.
- Countries of travel (as emission factors vary by country).
- Specific types of vehicles used for travel.
- The specific passenger vehicle type and relevant emission factor.
The emission factors should be expressed in units of greenhouse gases emitted per kilometre or per passenger-kilometre travelled. Companies may also collect emission factors for hotel stays by hotel type. Note that for air travel, corrections for radiative forcing may be applied to the Global Warming Potential (GWP) of emissions from aircraft transport.
The Spend-based Method
The Spend-based Method is employed when data on fuel consumption and distance covered in business travel is unavailable. This approach revolves around examining the financial expenditure associated with different modes of business travel. The process entails gathering expense data for each mode, categorising these expenses by transport type, applying specific emission factors to quantify emissions, and aggregating these emissions for an overall estimate. While it proves beneficial in data-scarce scenarios, this method relies on indirect estimation, potentially lacking precision compared to the fuel-based or distance-based methods. It operates under the assumption that emissions are directly proportional to expenses, which might not always hold true, but it remains a valuable approach when other data sources are unavailable.
Data Collection and Calculation Resources
Data can be collected through various means, including automatic tracking, surveys/questionnaires of employees, and working with travel providers to obtain GHG emissions data. If collecting data from all employees is impractical, extrapolation from a representative sample or grouping similar travel profiles can be considered.
Understanding and calculating emissions from business travel are vital steps for any organisation that wants to reduce its environmental impact. To do this effectively, it is important to carefully consider the available data sources and select the most appropriate calculation method for each type of travel. This will enable the organisation to develop and implement realistic and achievable emission reduction strategies.
Carbon Analytics Team
Related posts.

Scope 3 - Category 8: Upstream Leased Assets

Scope 3 - Category 7: Employee Commuting

Accelerating towards Net Zero with Carbon Management technologies
Subscribe to our newsletter.
This browser is no longer supported.
Upgrade to Microsoft Edge to take advantage of the latest features, security updates, and technical support.
Scope 3 emissions
- 6 contributors

Microsoft Sustainability Manager includes the capability to store activity data and calculate all scope 3 emissions. The solution can store emission data for any scope 3 category. Expanded functionality for each category is explained in more detail later in this article. For general information about scope 3 accounting, see Scope 3 Calculation Guidance from Greenhouse Gas Protocol .
Calculations for scope 3 categories 3, 10, 11, 14, and 15 are available as part of a preview release. The content and the functionality are subject to change.
Categories 1 and 2: Purchased goods and services and capital goods
Purchased goods and services, and capital goods, can be calculated in various ways. The activity data model that supports them can support different methods of activity data. However, the default method is the spend-based method that uses United States Environmental Protection Agency (EPA) supply chain factors.
This activity data model includes EPA supply chain factors and other reference data categories of spend types and value chain partners.

How to use EEIO model within Sustainability Manager:
- The quantity equals the cost, and the company spend code is used as reference data.
- The spend code is mapped to commodity codes that the EPA outlined in factor mappings.
- The calculation is Cost × Emission factor ( EF ) (for commodity code)
Currency conversions and their role in spend-based calculations
When you use Microsoft Sustainability Manager for spend-based calculations, we recommend that you explore the role that inflation plays in your inventory management plan. If you account for inflation in your inventory management plan, you probably convert current spend to the base year of your emission factors.
The factors that are stored in Microsoft Sustainability Manager are the 2018 EPA supply chain factors. Therefore, in our currency conversions, we not only convert across currencies but also account for inflation since 2018. In our demo currencies, you can see how this process occurs through the conversion factors.

Average data method
The average data method can easily be substituted for the spend method in four easy steps.
- Use the quantity and quantity unit that are provided. Use the goods quantity when mass or some other unit must be considered in the calculation.
- Substitute your material or goods data categories for the reference data spend categories.
- Substitute average data-based factors for your supply chain factors.
- Update the calculation model by selecting quantity as an input unit and selecting the new factor library.
Category 3: Fuel- and energy-related activities
Some or all of this functionality is available as part of a preview release. The content and the functionality are subject to change.
Fuel- and energy-related activities use scope 1 and scope 2 activity data for the calculations.
The calculation using scope 1 activity data (for example, mobile or stationary combustion) is:
Scope 3 category 3 emissions = ( Scope 1 activity data × Upstream emission factor )

The calculation using scope 2 activity data (for example, purchased energy) is:
Scope 3 category 3 emissions = ( Scope 2 activity data × Upstream emission factor ) + ( Scope 2 emissions data × Transmission and distribution factor )

Categories 4 and 9: Upstream and downstream transportation and distribution
Upstream and downstream transportation and distribution can be calculated by using distance, fuel, and cost. In general, the calculation considers weight conversions. Our default model includes EPA factors for transportation and distribution. It also includes a new reference data category for the mode of transport.
Distance method from table 8 :
Passenger vehicle distance in miles × EF = Greenhouse gas (GHG) per vehicle
Shared cargo vehicle distance in miles × Tons (short ton) of cargo × EF = GHG
Here's the calculation for category 4.

You can easily create a model that uses the fuel method. To create this model, you should look at examples from stationary combustion.
Categories 5 and 12: Waste generated in operations and end-of-life treatment of sold products
Waste generated in operations releases emissions created from the disposal of waste to another party. Organizations define waste included in this category in their GHG accounting scope. It's typically any waste picked up from operational activity and taken to a landfill, recycling facility, or to be composted.
End-of-life treatment of sold products releases emissions created from the waste disposal and treatment of products sold by the reporting company at the end of their life. This category includes the total expected end-of-life emissions from all products sold in the reporting year.
Sustainability Manager calculates waste generated in operations and end-of-life treatment of sold products. These calculations are based on the material and disposal method, and they use the EPA factors by default to convert activity data into emissions. However, if your organization uses alternate factors such as DEFRA or IPCC, you can ingest them into the tool as reference data and used in the calculation instead.
The following image shows how to upload your own reference data for category 5 or category 12.

For more information, review Emission factors documentation .
The calculation for category 5 and category 12 is:
- Waste produced × Emissions factor based on material and disposal method = GHG

The following factors are stored as default factors:
- Waste generated in operations (Category 5): Table 9
- GHG Emission Factors Hub (April 2022) (epa.gov)
Categories 6 and 7: Business travel and employee commuting
Business travel calculations include distance and hotel calculations. Our default model includes EPA factors for hotel stays and travel.
Employee commuting calculations include emissions from the transportation of employees between their homes and their worksites. Emissions from employee commuting arise from mobile combustion. You can include emissions from teleworking (employees working remotely) in this category by using the calculations for stationary combustion and purchased energy.
New categories of the accommodation and business travel type, together with new estimation factor nodes, make it easy to customize beyond the standards to supplier-specific factors.
Mobile combustion :
Preferred: Distance × EF (specific to vehicle type) = GHG
Distance method from table 10
Hotel stays (only applicable to Category 6 business travel):
Number of nights in hotels × Estimation/consumption factor from hotel or EPA hotel guidance = Energy and natural gas from hotel stays
Energy × EF = GHG
Fuel × EF = GHG
- Business travel (category 6): Table 10

Categories 8 and 13: Upstream and downstream leased assets
Upstream and downstream leased assets can be calculated by using energy or fugitive emissions data from a leased asset. For Upstream leased assets (Category 8), these emissions would be from an asset leased by the reporting company. For Downstream leased assets (Category 13), they would come from an asset that the reporting company leases to someone else.
Emissions from upstream and downstream leased assets can be calculated in several ways, and the activity data model supports them. However, our default model is the asset-specific method and includes EPA factors for purchased energy, fuels, and fugitive emissions. It also includes a new reference data category for the facility type and facility usage detail.
Asset-specific method from calculation formula 8.1 :
scope 1 emissions of leased asset = ∑ (quantity of fuel consumed (for example, liter) × emission factor for fuel source (for example, kg CO2 e/liter)) + ∑ ((quantity of refrigerant leakage (kg) × emission factor for refrigerant (kg CO2 e/kg)) + process emissions)
scope 2 emissions of leased asset = ∑ (quantity of electricity, steam, heating, cooling consumed (for example, kWh) × emission factor for electricity, steam, heating, cooling (for example, kg CO2 e/kWh))
Then sum across leased assets: ∑ scope 1 and scope 2 emissions of each leased asset

You can easily create a model that uses the lessor-specific method using total area/volume/quantity of the lessee/lessor’s and reporting company’s assets.
Category 10: Processing of sold products
The Processing of sold products category is emissions from processing sold intermediate products by other manufacturers. They can be calculated by uploading scope 3 category 10 activity data categorized into any of the scope 1 or scope 2 emission sources or scope 3 category 5: Waste generated in operations. The following emission sources are enabled for scope 3 category 10:
- Fugitive emissions
- Industrial process
- Mobile combustion
- Stationary combustion
- Purchased cooling
- Purchased electricity
- Purchased heat
- Purchased steam
- Waste generated in operations
This category has these new fields enabled:
- Account : Captures other manufacturers' data
- Sustainability product and Sustainability product ID : Ties emissions back to a particular product
Category 11: Use of sold products
Use of sold products are emissions from a customer's use or consumption of a company's products. This category can be calculated by using any of the scope 1 or scope 2 emission sources.
The following emission sources are enabled for scope 3 category 11:
- Account : Captures customer data
- Lifespan in years (calculated, read-only): Takes the difference between Consumption start date and Consumption end date to calculate the product's lifespan.
Our calculations assume that you want to follow GHG Protocol and report total product lifespan emissions at the time the product is sold.
Category 14: Franchises
This category captures indirect emissions resulting from franchisee activities. It can be calculated by using any of the scope 1 or scope 2 emission sources.
The following emission sources are enabled for scope 3 category 14:
This category has this new field enabled:
- Account : Captures franchisee data
Category 15: Investments
The Investments category is based on the Partnership for Carbon Accounting Financials (PCAF) methodology. It's an industry-led initiative enabling financial institutions to measure and disclose GHG emissions for loans and investments. PCAF defines the calculation for the attribution factor.
The basic calculation is:
Attribution factor × Emissions = Scope 3 category 15 emissions
For example: Bank A has a 30% equity stake in Investee 1. Thirty percent is the attribution factor, which is calculated according to the PCAF methodology. Bank A's emissions are 30% × Investee 1's emissions .
Users can currently ingest activity data where emissions are known but the attribution factor has to be calculated. We implemented PCAF Part A Financed Emissions, which include:
Listed equity and corporate bonds :
( Outstanding amount / EVIC or Total company equity + debt ) × Company emissions
where EVIC = enterprise value including cash
Business loans and unlisted equity :
Project finance :
( Outstanding amount / Total project equity + debt ) × Project emissions
Commercial real estate :
( Outstanding amount / Property value at origination ) × Building emissions
Mortgages :
Motor vehicles loans :
( Outstanding amount / Total value at origination ) × Vehicle emissions
Sovereign bonds :
( Exposure to sovereign bond (USD) / PPP-adjusted GDP (International USD) ) × Sovereign emissions
Additional resources
CDP Climate Change 2023 Reporting Guidance
(c6.5) account for your organization’s gross global scope 3 emissions, disclosing and explaining any exclusions., change from last year.
Modified guidance
For most companies, the majority of emissions occur in the value chain. CDP asks this question to gauge the thoroughness of companies’ accounting processes and to understand how companies are analyzing their emissions footprints.
Connection to other frameworks
Goal 12: Responsible consumption and production
Goal 13: Climate action
Metrics & Targets recommended disclosure b) Disclose Scope 1, Scope 2, and, if appropriate, Scope 3 greenhouse gas (GHG) emissions, and the related risks.
S&P Global Corporate Sustainability Assessment
Scope 3 Financed Absolute Emissions
Scope 3 Financed Emission Intensity
Scope 3 GHG Emissions
TCFD Disclosure
Response options
Please complete the following table:
Requested content
- According to the GHG Protocol’s Corporate Value Chain (Scope 3) Accounting and Reporting Standard (page 107): “Any estimates of avoided emissions must be reported separately from a company’s Scope 1, Scope 2, and Scope 3 emissions, rather than included or deducted from the Scope 3 inventory”. In the context of your CDP response, you can provide information on actions you take to reduce your Scope 3 emissions in question C4.3b on emissions reduction initiatives.
- You should complete every row of the table (with the exception of the last two rows “Other (upstream)” and “Other (downstream)” which are optional), but not necessarily all columns.
- The columns that you need to complete in response to question C6.5 will depend on your selection made in the “Evaluation status” column and are summarized in the guidance below for column 2 “Evaluation status”.
Scope 3 category (column 1)
- This column is already completed in the ORS and all categories will appear. The categories of Scope 3 emissions have been taken from the Greenhouse Gas Protocol’s Corporate Value Chain (Scope 3) Accounting and Reporting Standard, published in September 2011. Companies should refer to the standard for information on the emissions sources that each category comprises and additional information on how to calculate these emissions.
Evaluation status (column 2)
This column should be completed for all Scope 3 categories, with the exception of “Other (upstream)” and “Other (downstream)” – these two rows should only be used if companies have a source of Scope 3 emissions that is not provided in the categories above. The evaluation status includes two components: whether a Scope 3 category is relevant to your business and whether you have calculated the emissions in that category. Relevance should be determined with reference to the GHG Protocol Scope 3 standard and CDP's Technical Note on the relevance of Scope 3 categories by sector – see Additional Information for the Scope 3 relevance criteria . Select from:
- Relevant, calculated - Select this option if the Scope 3 category is relevant to your business and you have calculated the emissions associated with at least part of it. - Relevant, not yet calculated - Select this option if you are aware that the Scope 3 category is relevant to your business but you have not yet calculated the emissions associated with it. - Not relevant, calculated - Select this option if you know that this Scope 3 category is not one of the most important for your business but as part of your Scope 3 work, you have been able to calculate the emissions associated with it. - N ot relevant, explanation provided - Select this option if you have investigated this Scope 3 category and have been able to determine that it is not relevant. This could be based on quantitative or qualitative investigations. - Not evaluated - Select this option if you have not yet investigated this Scope 3 category and therefore do not know whether or not it is relevant for your business.
Emissions in reporting year (metric tons CO2e) (column 3)
- This column is only presented if “Relevant, calculated” or “Not relevant, calculated” is selected in column 2 “Evaluation status”.
- Enter the emissions appropriate to each Scope 3 category identified in metric tons CO2e, entering numbers only up to 99,999,999,999 without commas and up to three decimal places. Negative numbers are not allowed as reporting needs to be gross, not net figures. Emission figures should be for the reporting year only.
- Entering 0 implies that you have calculated the emissions associated with this category and they are equal to zero.
Emissions calculation methodology (column 4)
- Select the calculation methodology(ies) used to calculate the emissions associated with this Scope 3 category.
- You should consult the GHG Protocol’s Technical Guidance for Calculating Scope 3 Emissions for details of which emissions calculations methodologies are relevant to each Scope 3 category.
Percentage of emissions calculated using data obtained from suppliers or value chain partners (column 5)
- Such data obtained from suppliers or value chain partners may take the form of primary activity data, or emissions data calculated by suppliers that are specific to suppliers’ activities. More information on this can be found in Chapter 7, Collecting Data, of the GHG Protocol’s Corporate Value Chain (Scope 3) Accounting and Reporting Standard .
Please explain (column 6)
- For all Scope 3 categories that you have identified as “Relevant, calculated” or “Not relevant, calculated” in the “Evaluation status” column, provide a short description of the types and sources of data used to calculate emissions (e.g. activity data, emission factors and GWP values), and any further details of the emissions calculation methodology(ies) selected in column 5 such the assumptions and allocation methods used.
- State the extent of the boundary of your calculation – see pages 34-38 of the GHG Protocol’s Corporate Value Chain (Scope 3) Accounting and Reporting Standard for information on the minimum and, where applicable, optional boundary of each Scope 3 category.
- For all transport-related emissions (i.e., those in Scope 3 category 4: “Upstream transportation and distribution”, category 6: “Business travel”, category 7 “Employee commuting” and category 9: “Downstream transportation and distribution”), indicate the life cycle stages covered in your calculation (e.g., Well-to-Wheel etc.). See the Explanation of Terms for more information.
- Note that any exclusions within a Scope 3 category should not be detailed here, but should be disclosed in question C6.4a.
- For all Scope 3 categories that you have identified as “Not relevant, explanation provided” in the “Evaluation status” column, provide details of how you have reached the conclusion that the source is not relevant and include any qualitative or quantitative reasoning.
- If you wish to provide additional context to any of the rows in the table, such as to explain why emissions have decreased or increased, you can also do that in this column.
Note for all high-impact sector companies:
- Companies in one of CDP’s high impact sectors (see here for more information) should refer to CDP’s Technical Note on the relevance of Scope 3 categories by sector , which identifies the relevant and most significant Scope 3 categories for each sector based on a review of literature and analysis of CDP 2021 data.
Note for oil & gas and coal sector companies:
- CDP has produced sector-specific guidance for estimating Scope 3 category 11 (use of sold products) emissions for the Oil & Gas and Coal sectors.
Note for financial services sector companies:
- For financial services sector companies responding to the full version of the questionnaire, Scope 3 Category 15 “Investments” emissions has been pulled out of question C6.5 and is requested to be disclosed in C-FS14.1a. As the majority of emissions occur in relation to financial products and services and/or investments, financed emissions, or Scope 3 Category 15 “Investments” emissions as defined by the GHG Protocol is the most relevant category to financial services organizations.
- Thus, Row 15 “Investments” is hidden in this question, please disclose this in C-FS14.1a.
Note for companies responsible for the transportation (including maritime), storage, transmission and distribution of fossil fuels:
- Scope 3 emissions from the handling of fossil fuels can be significant, as highlighted by the IEEFA . Therefore, companies responsible for the transportation (including maritime), storage, transmission and distribution of fossil fuels should disclose emissions from the final use of these products as Scope 3 category 11 “Use of Sold Products”.
- Scope 3 category 11 emissions from fossil fuels should be calculated based on the throughput of fossil fuel products in your operations during the reporting year.
- As per the ACT initiative’s O&G Sector methodology , these emissions are a consequence of a companies’ activities even though the fossil fuels may not be owned by the company and thus are included in Scope 3.
- Please refer to the CDP Technical Note “ Guidance methodology for the estimation of Scope 3 category 11 emissions for oil and gas companies ” for further guidance.
Explanation of terms
- Well-to-Wheel (WTW) : A Well-to-Wheel analysis considers both the emissions from the vehicle itself, but also the emissions from the process of extracting the fuel used to power the vehicle's engine. It can be subdivided into the Well-to-Tank (WTT) (energy provision) analysis and the Tank-to-Wheel (TTW) (vehicle efficiency) analysis. Compared to a full emissions Life Cycle Assessment (LCA), the production, maintenance, and disposal of the vehicle are not assessed.
Example Response
Example response for the selection of “Relevant, calculated” in column 2.
Example response for the selection of “ Not relevant, explanation provided ” in column 2.
Additional information
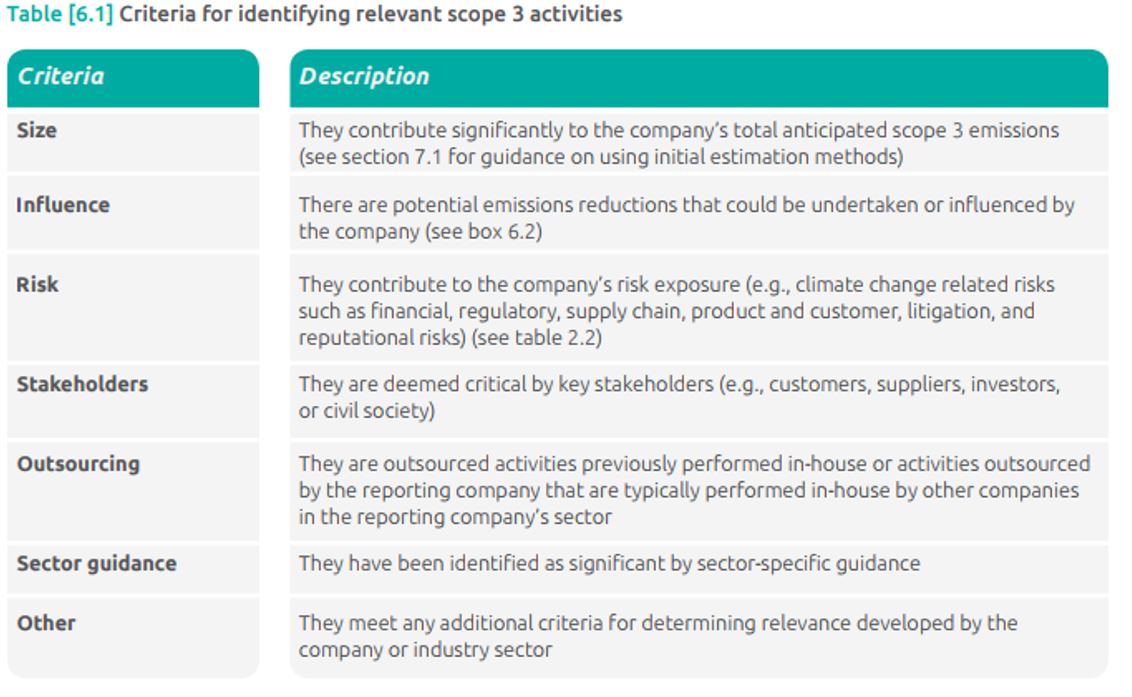
- Relevance criteria for Scope 3 emissions sources: Companies should not exclude any activity that would compromise the relevance of the reported inventory. The table below from the Corporate Value Chain (Scope 3) Accounting and Reporting Standard provides a list of criteria for determining relevance. Companies in one of CDP’s high-impact sectors should also refer to CDP’s Technical Note on the relevance of Scope 3 categories by sector , which identifies the relevant and most significant Scope 3 categories for each sector based on a review of literature and analysis of CDP 2021 data.
- Scope 3 screening tool: To help facilitate the adoption of the Scope 3 Standard and assist companies in determining the relevance of Scope 3 emissions sources, the GHG Protocol, in collaboration with Quantis, have released a free Scope 3 screening tool . This tool asks a number of relatively simple questions to approximate your Scope 3 inventory, and can be used by companies of all sizes and all sectors. Please note that this tool is not a data collection tool and should only be used to make a first approximation of your Scope 3 emissions. Having used the tool to help determine the relevance of Scope 3 categories, companies should then develop more accurate approaches for categories shown to be a relevant source of emissions.
Your document is now ready
An error occured, please try again.
Category 6 – Business Travel
- Ways to Give
- Contact an Expert
- Explore WRI Perspectives
Filter Your Site Experience by Topic
Applying the filters below will filter all articles, data, insights and projects by the topic area you select.
- All Topics Remove filter
- Climate filter site by Climate
- Cities filter site by Cities
- Energy filter site by Energy
- Food filter site by Food
- Forests filter site by Forests
- Freshwater filter site by Freshwater
- Ocean filter site by Ocean
- Business filter site by Business
- Economics filter site by Economics
- Finance filter site by Finance
- Equity & Governance filter site by Equity & Governance
Search WRI.org
Not sure where to find something? Search all of the site's content.
Sustainability Dashboard Methodology
Back to overview
QUICK LINKS
Inventory scope and organizational boundary, operational boundaries, methodology, scope 1 methodology, scope 2 methodology, scope 3 methodology, category 1: purchased goods and services, subgrants to partners, category 3: fuel and energy-related activities, category 5: waste generated in operations, category 6: business travel, category 7: employee commuting, category 15: investments.
This manual outlines the scope, organizational boundary, operational boundaries, and methodology of the World Resources Institute’s greenhouse gas inventory. These disclosures are consistent with the reporting requirements of the GHG Protocol Corporate Accounting and Reporting Standard, Revised Edition (2004) and the GHG Protocol Corporate Value Chain (Scope 3) Accounting and Reporting Standard (2011) . WRI will revise this manual at least annually to include developments such as changes in standards, operations, or methodology, and updated emission factors.
Table 1 | WRI Greenhouse Gas Inventory Scope
Note: a “Consolidation approach” refers to the method chosen to determine which sources of emissions are included in the GHG inventory, as defined by the Corporate Standard and Scope 3 Standard . More information can be found in Chapter 3 of the Corporate Standard and Chapter 5.2 of the Scope 3 Standard. Source: WRI.
Table 2 | Status of Emission Sources in WRI’s Greenhouse Gas Inventory
Note: a Exclusions are purposefully omitted from GHG emission sources because of their insignificance and are distinct from data or sources not included for reasons of data quality concerns or availability. Please review our methodology and approach for each emission source to learn about WRI’s inventory data limitations. b N/A = Not applicable.
Source: WRI.
General Formula Used to Calculate WRI’s Emissions
WRI’s GHG calculations follow the formula below unless otherwise indicated:
Activity data x emission factor x global warming potential (GWP) = CO 2 equivalent (CO 2 e) emissions
- Activity data is a quantitative measure of a level of activity (e.g. liters of fuel consumed, kilometers traveled, etc.) that results in GHG emissions
- Emission factor is a factor that converts activity data into GHG emissions data (e.g. kg CO 2 emitted per liter of fuel consumed, kg CH 4 emitted per kilometer traveled, etc.)
- Global warming potential (GWP) is a factor describing the radiative forcing impact (degree of harm to the atmosphere) of one unit of a given GHG, relative to one unit of CO 2 over a 100-year time horizon. Multiplying emissions of a given GHG by its GWP gives us the CO 2 equivalent emissions.
The global warming potential factors, detailed methodology, and emission factors used for each emission source are listed in this manual.
Global Warming Potentials Used to Calculate WRI’s Emissions
Table 3 | global warming potentials used in this inventory.
Scope 1 includes direct GHG emissions from sources that are owned or controlled by the company. For example, emissions from combustion in owned or controlled boilers, furnaces, or vehicles; and emissions from chemical production in owned or controlled process equipment.
Table 4 | Approach for Diesel Generators
Table 5 | emission factors for diesel generators, table 6 | approach for office refrigerators.
Notes: a GWP = Global warming potential. Source: WRI.
Table 7 | Emission Factors for Office Refrigerators
Scope 2 includes GHG emissions from the generation of purchased electricity consumed by the company. Purchased electricity is electricity to be consumed that is purchased or otherwise brought into the organizational boundary of the company. Scope 2 guidance requires dual reporting, following emission factor hierarchies.
Location-based Method
The location-based method calculates emissions based on electricity consumption at the location where the energy is used, taking into account the fuel mix used to generate electricity within the locations and time periods in which WRI operates. WRI uses local or country-level grid average emission factors to report location-based emissions for all offices included in the inventory scope.
Table 8 | Location-based Approach
Notes: a See Table 9 Source: WRI.
Table 9 | Average Energy Intensity for Climate Zones
Table 10 | emission factors for location-based method.
Notes: a N/A = Not applicable. Source: WRI.
Market-based Method
The market-based method shows emissions for which WRI is responsible through its purchasing decisions based on contractual emissions.
Table 11 | Market-based Approach
Notes: a NERC = North American Electric Reliability Corporation. b RFC East = Reliability First Corporation/East Source: WRI.
Table 12 | Quality Criteria for Market-based Method
Table 13 | emission factors for market-based method.
Source: WRI
This category includes all upstream (i.e. cradle-to-gate) emissions from the production of goods (tangible products), as well as services and subgrants (intangible products). WRI uses the spend-based approach to estimate emissions for goods, services, and partners by multiplying the economic value of goods, services, and subgrants (i.e. spend data) by relevant industry average emission factors (i.e. emissions per dollar spent).
Table 14 | Approach for Category 1
Table 15 | sample of emission factors for category 1.
Notes: a USEEIO = United States Environmentally Extended Input-Output Model
This category includes indirect upstream emissions related to the production of fuels and energy purchased and consumed in the reporting year, which are not included in Scope 1 or Scope 2. For WRI, these emissions include well-to-tank (WTT) emissions of purchased fuels, well-to-tank (WTT) emissions of purchased electricity, and transmission and distribution (T&D) losses for purchased electricity. WTT emissions account for the emissions arising from the extraction, production, and transportation of fuels consumed or used to generate electricity. Since WRI does not produce energy directly, it uses the average-data method to estimate emissions by using secondary regional-average emission factors for upstream emissions per unit of consumption.
Table 16 | Approach for Category 3
Notes: a DEFRA = Department for Environment, Food, and Rural Affairs (UK). Source: WRI.
Table 17 | Well-to-tank (WTT) Emission Factors for Diesel Fuel
Notes: a DEFRA did not publish well-to-tank conversion factors for 2010 or 2011, so 2012 conversion factors were used. Source: WRI.
Table 18 | Well-to-tank (WTT) Emission Factors for Purchased Electricity
Table 19 | transmission and distribution (t&d) losses emission factors for purchased electricity.
Notes: a DEFRA stopped publishing transmission and distribution conversion factors in 2018, so 2017 conversion factors were used. Source: WRI.
This category includes emissions from third-party disposal and treatment of solid waste and wastewater that is generated in the reporting company’s owned or controlled operations in the reporting year. For solid waste, WRI uses the waste-type-specific method to estimate emissions. WRI does not report emissions from wastewater treatment, as it is currently unable to obtain this data.
Table 20 | Approach for Category 5
a EPA WARM = Environmental Protection Agency Waste Reduction Model
b GHGP = Greenhouse Gas Protocol
Table 21 | Emission Factors for Category 5
This category includes emissions from the transportation of employees for business-related activities in vehicles owned or operated by third parties, such as aircraft, trains, buses, and passenger cars. WRI uses the distance-based approach to estimate emissions from air and rail travel, by multiplying the distance traveled by mode-specific emission factors.
Table 22 | Approach for Category 6
Notes: a DEFRA = Department for Environment, Food, and Rural Affairs (UK). b EPA = Environmental Protection Agency (US). Source: WRI.
Table 23 | Emission Factors for Air Travel
a The DEFRA conversion factor selected reflects emissions per unit distance for an economy class passenger, with radiative forcing impacts.
b 2012 conversion factors from DEFRA were used for 2010, 2011, and 2012.
Table 24 | Emission Factors for Rail Travel
This category includes emissions from the transportation of employees between their homes and worksites. WRI uses the distance-based method to calculate emissions.
Table 25 | Approach for Category 7
Table 26 | us emission factors for category 7.
a Environmental Protection Agency (US).
b 2015 emissions were extrapolated by taking the average of 2014 and 2016 emissions from each mode of transportation. No activity data or emission factors were used.
c N/R = Not reported - associated activity data not collected, extrapolated from surrounding year data.
Table 27 | Non-US Emission Factors for Category 7
a DEFRA = Department for Environment, Food, and Rural Affairs (UK).
b EMBARQ was founded in 2002 and is now part of WRI Ross Center for Sustainable Cities. EMBARQ works to advance sustainable urban mobility solutions.
This category includes emissions from WRI's US-based endowment portfolio. WRI does not report emissions from any operational financial accounts, staff retirement accounts, or operating reserve funds.
Table 28 | Approach for Category 15
a PCAF = Partnership for Carbon Accounting Financials
b CDP = formerly Carbon Disclosure Project, now known as CDP, provides company reported sustainability data on climate, water, forests.
c EEIO = Environmentally Extended Input-Output Model
d US EPA = US Environmental Protection Agency
Source: WRI & Agendi, Inc.
How You Can Help
WRI relies on the generosity of donors like you to turn research into action. You can support our work by making a gift today or exploring other ways to give.
Stay Informed
World Resources Institute 10 G Street NE Suite 800 Washington DC 20002 +1 (202) 729-7600
© 2024 World Resources Institute
Envision a world where everyone can enjoy clean air, walkable cities, vibrant landscapes, nutritious food and affordable energy.

An official website of the United States government
Here’s how you know
Official websites use .gov A .gov website belongs to an official government organization in the United States.
Secure .gov websites use HTTPS A lock ( Lock A locked padlock ) or https:// means you’ve safely connected to the .gov website. Share sensitive information only on official, secure websites.
JavaScript appears to be disabled on this computer. Please click here to see any active alerts .
- Scope 3 Inventory Guidance
On this page:
Description of Scope 3 Emissions
Scope 3 calculation: practical guidance.
- Supply Chain Guidance
Scope 3 Emission Factors
Scope 3 resources.
Scope 3 emissions are the result of activities from assets not owned or controlled by the reporting organization, but that the organization indirectly affects in its value chain. An organization’s value chain consists of both its upstream and downstream activities. Scope 3 emissions include all sources not within an organization’s scope 1 and 2 boundary. The scope 3 emissions for one organization are the scope 1 and 2 emissions of another organization. Scope 3 emissions, also referred to as value chain emissions, often represent the majority of an organization’s total greenhouse gas (GHG) emissions.
The GHG Protocol defines 15 categories of scope 3 emissions, though not every category will be relevant to all organizations (see Figure 1). Scope 3 emission sources include emissions both upstream and downstream of the organization’s activities.
To fully meet GHG Protocol standards, an organization must report emissions from all relevant scope 3 categories. More organizations are reaching into their value chains to understand the full GHG impact of their operations. In addition, because scope 3 sources may represent most of an organization’s GHG emissions, they often offer emissions reduction opportunities. Although these emissions are not under the organization’s control, the organization may be able to affect the activities that result in the emissions. The organization may also be able to influence its suppliers or choose which vendors to contract with based on their practices.
The GHG Protocol's Corporate Value Chain (Scope 3) Accounting and Reporting Standard (“Scope 3 Standard”) presents details on all scope 3 categories and requirements and guidance on reporting scope 3 emissions.
Figure 1. Overview of GHG Protocol scopes and emissions across the value chain

The Scope 3 Standard presents details on all scope 3 categories and requirements and guidance on reporting scope 3 emissions. The practical guidance below provides further suggestions on calculating scope 3 emissions.
Establishing a relevant, complete, consistent, transparent, and accurate scope 3 emissions inventory is a process of continuous improvement. Table 1 provides a description of organizational phases of scope 3 engagement for common inventorying best practices. For some organizations, understanding GHG inventorying efforts within the broader market may spur competition and garner internal support for widening inventorying activities.
Quantifying scope 3 emissions can be broken into three steps:

Step 1: Determine relevant scope 3 categories
The first step is a relevance assessment to determine which of the 15 categories are relevant to the reporting organization. Table 6.1 of the Scope 3 Standard provides criteria to identify relevant scope 3 activities:
- Stakeholders
- Outsourcing
- Sector guidance
To determine relevance, the organization can review the Scope 3 Standard’s description of each scope 3 category and consult appropriate contacts across the organization. In some cases, an emissions estimate may be necessary to determine if the category is relevant based on size. A rough estimate will suffice, but if that is not possible, then proceed to step 2 to estimate emissions.
Step 2: Estimate GHG emissions
Estimates for scope 3 categories can vary in accuracy depending on the available data and the organization’s quantification goal. For example, category 4 (upstream transportation and distribution) has three methods: fuel-based, distance-based, and spend-based. The GHG Emission Factors Hub provides factors for several scope 3 categories and indicates the calculation methods with which the factors align. For example, Table 8 of the GHG Emission Factors Hub lists factors aligned with the distance-based method. If fuel activity data are available, the fuel-based method should be used, so the factors presented in Tables 2 and 3 would be applicable. See the “Scope 3 Emission Factors” section below for more details.
The GHG Protocol provides Scope 3 Calculation Guidance which details multiple calculation methods for each scope 3 category based on level of specificity and available data.
For financial institutions, The Global GHG Accounting and Reporting Standard for the Financial Industry , published by the Partnership for Carbon Accounting Financials , offers specific guidance on calculating scope 3, category 15 (investments) emissions.
Step 3: Improve and expand emissions estimate over time
Many organizations will improve the accuracy of scope 3 emissions over time and expand to include more categories as adequate data become available.
- More accurate data sources. This could include moving from secondary sources to primary ones. For example, in the first year of reporting, an organization may only be able to track spend for business travel, but in subsequent years, miles traveled by type (air, rail, car) may be available.
- More specific calculation methods. It is appropriate to use a combination of calculation methods within a category (for example, collecting supplier emissions data for high emissions suppliers and estimating based on spend for the remaining suppliers). However, these methods should remain consistent for year-over-year comparison; any change in method used will require historical adjustments (see Chapter 9 of the Scope 3 Standard ).
Some scope 3 categories may be relevant, but initially lack readily available data to use in estimating emissions. The organization may be able to expand its reporting by estimating these relevant categories in the future, which is recommended to increase completeness.
When making these improvements, it is recommended to focus first on categories with the largest impact on the organization’s total GHG inventory.
Figure 2 shows an example progression over time of improvement and expansion. Five categories are reported in year one and 12 in year five. Only two categories use a specific method (e.g., supplier-specific method, fuel-based method) in year one and seven in year five.
Figure 2. Scope 3 calculation method improved and boundary expanded over time

An organization’s supply chain comprises its upstream activities (see Figure 1 above ). Organizations' supply chains emissions are, on average, 11.4 times higher than operational emissions, which equates to approximately 92% of an organization's total GHG emissions (Source: CDP 2020 Global Supply Chain Report ).
EPA’s supply chain guidance provides information on:
- Why engage suppliers?
- How to engage suppliers.
- Building internal support in supply chain management.
- Leveraging third-party programs.
- Examples of sector-specific engagement.
- Resources for reducing supply chain emissions.
Table 2 shows EPA's recommended source of emission factors for each scope 3 category. The most common sources listed in the table are:
- EPA's USEEIO supply chain GHG emission factors are based on US Environmentally-Extended Input-Output models and are presented in emissions per dollar of spend.
- EPA's GHG Emission Factors Hub provides factors for most scope 3 categories. Some categories do not require specific emission factors, because the emissions-generating activities have associated scope 1 and scope 2 factors already available.
To apply the EF Hub scope 1 and 2 factors, the organization can first define the GHG generating activity for each relevant source category, then apply the appropriate factors for stationary combustion, mobile combustion, fugitive emissions, electricity, heat, or steam.
For example, if an organization produces electronic equipment, Category 11 (use of sold products) may likely be a large source of emissions. To calculate emissions, estimate the lifetime electricity consumption (in kWh) for all products sold in the reporting year. Then calculate electricity emissions using emission factors in the EF Hub. Depending on the data available for the location of product use, apply eGRID subregion or U.S. national average factors.
Standards and Guidance
- Renewable Electricity Procurement on Behalf of Others: A Corporate Reporting Guide (pdf) discusses guiding principles for procuring renewable electricity on behalf of value chain partners and provides examples for several procurement scenarios as a supplement to the GHG Protocol Scope 2 Guidance for renewable electricity procurement within a reporting entity's value chain.
- Greenhouse Gas Inventory Guidance: Indirect Emissions from Events and Conferences (pdf) covers indirect emissions—including emissions from travel, hotel stays, and the venue itself—for events (e.g., sporting events, concerts) and conferences (e.g., business meetings, exhibits, conventions).
- ENERGY STAR Scope 3 Use of Sold Products Analysis Tool V1.2 (xlsm) allows retailers to benchmark and project corporate scope 3 GHG emissions associated with the use of sold products. Developed jointly with EPA's Center for Corporate Climate Leadership, this tool quantifies emissions associated with current sales of ENERGY STAR products and forecasts reductions in emissions based on increases in sales of ENERGY STAR products. With over 70 categories, it can help retailers of any size pinpoint the types and quantities of ENERGY STAR products that will bring them closer to meeting or beating their corporate carbon emission goals.
- Center for Corporate Climate Leadership Home
- Getting Started – Corporate Climate Leadership
- Determine Organizational Boundaries
- Scope 1 & Scope 2 Inventory Guidance
- GHG Emission Factors Hub
- Simplified GHG Emissions Calculator
- Inventory Management Plan Guidance
- Target Setting
- Climate-Related Financial Risks and Opportunities
- Climate Transition Planning
- Webinars & Events
Subscribe to GHG Protocol's email list HERE , Access information about the corporate suite of standards update process HERE

Scope 3 Calculation Guidance
An effective corporate climate change strategy requires a detailed understanding of a company’s greenhouse gas (GHG) emissions. Until recently, most companies have focused on measuring emissions from their own operations and electricity consumption, using the GHG Protocol’s scope 1 and scope 2 framework. But what about all of the emissions a company is responsible for outside of its own walls—from the goods it purchases to the disposal of the products it sells?
The Scope 3 Standard is the only internationally accepted method for companies to account for these types of value chain emissions. Building on this standard, GHG Protocol has now released a companion guide that makes it even easier for businesses to complete their scope 3 inventories.
About the Scope 3 Guidance
Assessing GHG emissions across the entire value chain can be complex. For companies just beginning to assess their scope 3 emissions, it can be difficult to know where to start. This calculation guidance is designed to reduce those barriers by providing detailed, technical guidance on all the relevant calculation methods. It provides information not contained in the Scope 3 Standard, such as:
- Methods for calculating GHG emissions for each of the 15 categories of scope 3 emissions (such as purchased goods and services, transportation and distribution, and use of sold products);
- Guidance on selecting the appropriate calculation methods; and
- Examples to demonstrate each calculation method.
The guidance can help companies understand the full climate change impact of their business throughout its value chain and develop more effective GHG reduction strategies. This increased understanding can benefit the companies themselves, as well as their suppliers, customers, and other value chain partners. The guidance was developed in partnership with the Carbon Trust , whose GHG measurement expertise and practical experience has helped develop calculation guidance that provides a clear and coherent approach to carrying out a scope 3 assessment.
What's Changed Since the First Draft?
A first draft of the calculation guidance was released in late 2011 for public comment. Based on the feedback received, a number of revisions were made to the guidance. These included:
- Revised decision trees for many of the categories
- More detail on the calculation methods for category 1 ‘Purchased goods and services’, in particular the ‘hybrid method’
- More guidance for category 5 ‘Waste generated in operations’, in particular in relation to recycling and waste-to-energy
- Extended guidance on category 15 ‘Investments’
The guidance for each category of scope 3 emissions can be downloaded separately. Appendix D also contains a table that summarizes the different calculation methods available for each of the categories.
Corporate Value Chain (Scope 3) Standard

The Corporate Value Chain (Scope 3) Standard allows companies to assess their entire value chain emissions impact and identify where to focus reduction activities.

Corporate Value Chain (Scope 3) Standard Online Course

Introduction
Date: April 2013 Size: 1.75 MB
Category 1 - Purchased goods and services
Date: April 2013 Size: 607.85 KB
Category 2 - Capital goods
Date: April 2013 Size: 181.49 KB
Category 3 - Fuel- and energy-related activities
Date: April 2013 Size: 443.25 KB
Category 4 - Upstream transportation and distribution
Date: October 2013 Size: 567.97 KB
Category 5 - Waste generated in operations
Date: April 2013 Size: 477.3 KB

Category 6 - Business travel
Date: April 2013 Size: 233.89 KB
Category 7 - Employee commuting
Date: April 2013 Size: 225.43 KB
Category 8 - Upstream leased assets
Date: April 2013 Size: 234.59 KB
Category 9 - Downstream transportation and distribution
Date: April 2013 Size: 334.68 KB
Category 10 - Processing of sold products
Date: April 2013 Size: 230.57 KB
Category 11 - Use of sold products
Date: April 2013 Size: 288.39 KB
Category 12 - End-of-life treatment of sold products
Date: April 2013 Size: 200.77 KB

Category 13 - Downstream leased assets
Date: April 2013 Size: 171.62 KB
Category 14 - Franchises
Date: April 2013 Size: 229.08 KB
Category 15 - Investments
Date: April 2013 Size: 327.61 KB
Appendix A - Sampling
Date: April 2013 Size: 202.11 KB
Appendix B - Scenario Uncertainty
Date: April 2013 Size: 182.33 KB
Appendix C - Intensity Metrics
Date: April 2013 Size: 173.42 KB
Appendix D - Summary Tables
Date: April 2013 Size: 235.17 KB
Related News

Seeking Participation in the Beta Test of a New GHGP Cross-Sector Corporate Calculation Tool
New excel-based tool from Greenhouse Gas Protocol and WRI that helps companies estimate their greenhouse gas (GHG) emissions based on the GHG Protocol.

Webinar: Greenhouse Gas Protocol and Science-based Targets for Forest, Land and Agriculture (FLAG) | Mar. 3

Many Companies Inaccurately Estimate the Climate Benefits of Their Products
Cold-water laundry detergents, fuel-saving tires, energy-efficient ball bearings, emissions-saving data centers. Corporations are increasingly claiming that their goods and services reduce emissions. But there is a big problem: These avoided emissions claims are often unverifiable or inaccurate.
- Read more news
ClimateCamp
Unpacking scope 3 emissions: the different categories explained.
As we know Scope 3 pertains to all the indirect emissions that take place within a company's value chain. The 15 categories under scope 3 serve as a structured model for companies to quantify, oversee, and curtail emissions across their corporate value chain. These categories are exclusively formulated to prevent any possibility of the company accounting for emissions twice under multiple categories. Here you can learn briefly about the different categories and their definitions.
Upstream Activities
Upstream emissions are generated during the production of a company's goods or services

Category 1: Purchased Goods & Services
The procurement, manufacturing, and delivery of goods and services obtained by your organization during the reporting year that do not fall under any of the categories 2-8. This includes the extraction, production, and transportation of such goods and services that were acquired or purchased by your organization . Learn More
Category 2: Capital Goods
The emissions related to the manufacturing, extraction, or transportation of a product . That come from capital goods, which are physical assets, such as equipment, machinery, and buildings, that organizations use to produce goods or provide services. Within the organization's reporting year. Learn More
Category 3: Fuel- and energy-related activities (not included in Scope 1 or Scope 2)
The indirect GHG emissions resulting from fuel and energy-related activities that are not covered in Scope 1 or Scope 2. This category includes GHG emissions that occur outside your organization's own operations but are still associated with its activities or products. For instance, if a company's employees travel to work using personal vehicles, the GHG emissions associated with their transportation would be included in Category 3 emissions. Learn More
Category 4: Upstream transportation and distribution
The emissions associated with the movement and delivery of goods bought by your organization during the reporting year, between your organization's primary suppliers and its own operations using transportation and facilitates not owned or managed by your organization . This includes logistics, outbound logistics for sold products, as well as transportation and distribution between your organization's own facilities. These transportation and distribution services were procured by your organization during the reporting year. Learn More
Category 5: Waste generated in operations
Includes the GHG emissions associated with the use of a company's products or services, including emissions resulting from the energy used to operate or maintain those products . This can include emissions from the use of consumer goods, such as appliances or electronics, as well as emissions from the use of industrial equipment or machinery. For instance, if a company produces and sells air conditioners, the GHG emissions associated with the energy used to operate those air conditioners would be included in Category 5 emissions. Learn More
Category 6: Business travel
During the reporting year, your organization facilitated the transportation of its employees for business-related activities using vehicles that were neither owned nor operated by your organization. Learn More
Category 7: Employee Commuting
These emissions are those emitted during the reporting year, your organization facilitated the transportation of its employees between their homes and worksites using vehicles that were neither owned nor operated by your organization. Learn More
Category 8: Upstream leased assets
The lessee reported on the operation of assets leased by your organization during the reporting year that were not included in their Scope 1 and Scope 2 emissions. Learn More
Downstream Activities
Downstream emissions occur during their usage and disposal.

Category 9: Downstream transportation and distribution
During the reporting year, your organization transported and distributed its products to end consumers, including retail and storage, using vehicles and facilities that were not owned or controlled and paid for by your organization. Learn More
Category 10: Processing of sold products
This category involves the processing of intermediate products sold by downstream organizations, such as manufacturers, during the reporting year. Learn More
Category 11: Use of sold products
The consumption of products and services sold by the reporting your organization during the reporting year . Learn More
Category 12: End-of-life treatment of sold products
The disposal and treatment of products sold by your organization at the end of their useful life during the reporting year. Learn More
Category 13: Downstream leased assets
The lessor reported (your organization) on the operation of assets you own and lease to other entities during the reporting year, which are not included in their Scope 1 and Scope 2 emissions . Learn More
Category 14: Franchises
The franchisor reported on the operation of franchises that were not included in their Scope 1 and Scope 2 emissions during the reporting year . Learn More
Category 15: Investments
The operation of investments, such as equity and debt investments and project finance , that were not included in their Scope 1 or Scope 2 emissions during the reporting year . Learn More
In Conclusion
Scope 3 categories are an essential aspect of measuring an organization's environmental impact. While Scope 1 and Scope 2 emissions are relatively easy to measure, Scope 3 emissions are often more complex and require a deep understanding of an organization's entire value chain , including suppliers, customers, and product end-of-life stages. The 15 categories outlined by the Greenhouse Gas Protocol provide a comprehensive framework for organizations to identify and measure their Scope 3 emissions, allowing them to make more informed decisions about sustainability initiatives and reduce their overall environmental impact. By considering Scope 3 emissions, organizations can enhance their sustainability efforts and build a more resilient and responsible business model for the future.
Related Articles

Scope 3 emissions & CSRD: all you need to know.
Csrd: what does it mean.
On the 10 th of November the European Parliament approved the Corporate Sustainability Reporting Directive (CSRD) as part of the EU legal...
Decoding the CBAM: A Strategic Guide for Businesses
An official website of the United States government.
This is not the current EPA website. To navigate to the current EPA website, please go to www.epa.gov . This website is historical material reflecting the EPA website as it existed on January 19, 2021. This website is no longer updated and links to external websites and some internal pages may not work. More information »
EPA Center for Corporate Climate Leadership
- Scope 3 Inventory Guidance
On this page
Description of scope 3 emissions, scope 3 resources, scope 3 emission factors.
Scope 3 emissions are the result of activities from assets not owned or controlled by the reporting organization, but that the organization indirectly impacts in its value chain. Scope 3 emissions include all sources not within an organization’s scope 1 and 2 boundary. The scope 3 emissions for one organization are the scope 1 and 2 emissions of another organization. Scope 3 emissions, also referred to as value chain emissions, often represent the majority of an organization’s total GHG emissions.
Scope 3 emissions fall within 15 categories, though not every category will be relevant to all organizations. Scope 3 emission sources include emissions both upstream and downstream of the organization’s activities.
According to the GHG Corporate Protocol, all organizations should quantify scope 1 and 2 emissions when reporting and disclosing GHG emissions, while scope 3 emissions quantification is not required. However, more organizations are reaching into their value chain to understand the full GHG impact of their operations. In addition, because scope 3 emission sources may represent the majority of an organization’s GHG emissions, they often offer emissions reduction opportunities. Although these emissions are not under the organization’s control, the organization may be able to impact the activities that result in the emissions. The organization may also be able to influence its suppliers or choose which vendors to contract with based on their practices.
For a complete description of all scope 3 categories and quantification methods, see the GHG Protocol Corporate Value Chain (Scope 3) Accounting and Reporting Standard Exit .
Overview of GHG Protocol scopes and emissions across the value chain

The GHG Protocol Corporate Value Chain (Scope 3) Accounting and Reporting Standard Exit presents details on all scope 3 categories and requirements and guidance on reporting scope 3 emissions.
The GHG Protocol also provides the following additional scope 3 resources:
- Guidance for Calculating Scope 3 Emissions Exit for each category, including guidance on required data, data collection methods, and quantification methods
- The Scope 3 Evaluator tool Exit to help organizations screen scope 3 emissions categories to identifying focus areas
- Guidance for calculating scope 3 emissions resulting from events (e.g., sporting events, concerts) and conferences (e.g., business meetings, exhibits, conventions). The emissions sources covered include: travel to and from an event, emissions from hotel stays by attendees, and emissions from the event or conference venue.
Depending on the source, scope 3 emissions can be quantified using either primary data specific to the activity within a company’s value chain, or by using secondary data such as industry averages, proxy data, or other generic data. Primary data must often be collected directly from suppliers through a questionnaire or similar format .
EPA currently provides certain scope 3 emission factors. The sections below discuss the currently available emission factors and how to apply scope 1 and 2 factors to calculate scope 3 emissions for certain categories. The categories listed are those defined in the GHG Protocol Scope 3 Standard Exit .
Emission Factors Currently Available
The GHG Emission Factors Hub currently contains factors applicable to five scope 3 categories. Below is a list of emission sources and the location of the factors in the GHG Emission Factors Hub.
- Upstream Transportation and Distribution (Category 4): Table 8
- Downstream Transportation and Distribution (Category 9): Table 8 1
- Waste Generated in Operations (Category 5): Table 9
- End-of-life treatment of sold products (Category 12): Table 9
- Business Travel (Category 6): Table 10
- Employee Commuting (Category 7): Table 10 2
Emission Source Categories Using Scope 1 and 2 Emission Factors
Some scope 3 categories do not require specific emission factors, because the emissions-generating activities have associated scope 1 and scope 2 factors already available in the GHG Emission Factors Hub . These sources include:
- Upstream leased assets (Category 8)
- Processing of sold products (Category 10)
- Use of sold products (Category 11)
- Downstream leased assets (Category 13)
- Franchises (Category 14)
- Investments (Category 15)
An organization may first define the GHG generating activity for each relevant source category, and then apply the appropriate factors for stationary combustion, mobile combustion, fugitive emissions, electricity, heat or steam from the GHG Emission Factors Hub .
For example, assume your organization produces electronic equipment. The downstream use of sold products (Category 11) may likely be a large source of emissions. In order to calculate emissions, estimate the lifetime electricity consumption (kWh) for all products sold in the reporting year. Then calculate emissions the same as for scope 2 electricity, using eGRID emission factors . Depending on the data available for the location of product use, eGRID subregion or U.S. national average factors would be applied.
1 These factors are applicable to all transportation; upstream or downstream, product-related or not. 2 These factors are applicable to employee commuting as well as business travel.
Top of Page
Contact Us to ask a question, provide feedback, or report a problem.
- Center for Corporate Climate Leadership Home
- About the Center
- Inventory Guidance for Low Emitters
- Scope 1 & Scope 2 Inventory Guidance
- GHG Emission Factors Hub
- Inventory Management Plan Guidance
- Corporate GHG Inventorying and Target Setting Self-Assessment
- Goal Setting
- GHG Reduction Programs & Strategies
- Supply Chain Guidance
- Climate Leadership Awards
- Webinars and Events
About 20 mins
Learning Objectives
Create a scope 3 emissions source, all about air travel, taxis, trains, limos, and buses, what about rental cars, factor in hotel stays.
- Challenge +100 points
Calculate Emissions from Business Travel
After completing this unit, you’ll be able to:
- Calculate air travel emissions.
- Calculate ground travel and rental car emissions.
- Calculate hotel stay emissions.
In this unit, we’ll follow along as Sam calculates emissions from air travel, ground travel and rental cars, and hotel stays. To account for such business travel emissions, Sam creates a Scope 3 Emissions Source record with the following key details.
- Name: NTO Scope 3 2021
- Scope 3 Emissions Source Type: Business Travel
- Air Travel Emissions Factor: Air Travel Factors - US EPA 2018
- Ground Travel Emissions Factor: Scope 3 Ground Travel - AMER - US EPA 2018
- Rental Car Emissions Factor: Rental Car - Standard class - US EPA 2020
- Hotel Stay Emissions Factor: United States - DEFRA 2019
Sam can associate energy use records for air travel, ground travel, rental cars, and hotel stays to this Scope 3 Emissions Source record. Sam understands that Net Zero Cloud comes with preloaded emissions factors data for business travel, and that NTO can also add its own.

As per the GHG Protocol, business travel is a primary contributor to scope 3 emissions. Emissions from business travel may arise from:
- Rail, bus, or other modes of travel
- Business travel in rental cars or employee-owned vehicles other than employees commuting to and from work
- Business travelers staying in hotels
In a global company like NTO, employees attend sales conferences, travel to different office hub locations, participate in seminars, and visit vendor sites. Sam Rajan must account for all such business travel-related emissions and associate the activity data with the Scope 3 Emissions Source record. Sam gets NTO’s business travel data from their corporate travel booking system and starts with air travel emissions.
First up, Sam explores the key fields and calculations for air travel emissions. Sam creates an Air Travel Energy Use record and associates it to records Scope 3 Emissions Source and Air Travel Emissions Factor.
The key fields on an Air Travel Energy Use record that are used for calculations are Segment Distance and Segment Distance Unit.

Based on the distance you cover by flight, there are three different flight distance categories (referred to as the haul length). On the Air Travel Emissions Factor record, emissions factors are recorded for each flight distance category. These emissions factors are usually expressed in units of greenhouse gas (CO₂, CH₄, N₂O) emitted per passenger-kilometer or passenger-mile traveled.
Air Travel Emissions Calculations
Sam records the following data for air travel on an Air Travel Energy Use record.
- Segment Distance: 1000
- Segment Distance Unit: Miles
The Air Travel Factors - US EPA 2018 record specifies the following key details.
The segment distance of 1000 miles is automatically determined as Medium because the value falls between short-haul and medium-haul in the associated Air Travel Emission Factor record.

Here’s how Net Zero Cloud automatically calculates air travel emissions.
Scope 3 Emissions (tCO₂e) = Segment Distance * {CO₂/Passenger-mile (kg) + CH₄/Passenger-mile (kg CO₂e) + N₂O/Passenger-mile (kg CO₂e)}
= 1000*(0.136+0.0000168+0.0011395) = 0.1372 tCO₂e.

Next, Sam focuses on emissions from other modes of travel, such as ground travel.
For train, taxi, bus, subway, personal car, or limo trips, Sam creates Ground Travel Energy Use records and specifies the cost of the trip and the expense currency. Net Zero Cloud is designed keeping in mind the different ways companies receive data for such trips. When you travel in a limousine, taxi, bus, or train, you would note the price you paid, while for personal cars, you would log the distance you traveled.

On the Ground Travel Emissions Factor record, the application refers to the CO₂-equivalent measured in kilograms for each kilometer traveled, whether by train, personal car, limo, or taxi. The Expense Type field on the record determines which emissions factors are used in the calculations.

Ground Travel Emissions Calculations
Sam gathers the following data for ground travel on the energy use record.
- Trip Cost: 200
- Currency Code: USD
- Expense Type: Taxi
For the calculation, Sam uses the Scope 3 Ground Travel - US EPA 2018 record, which specifies the following values.
- Taxi Rate (Cost/Distance Unit): 2.00
- Distance Unit: Miles
- Taxi Emissions (kg CO₂e/Distance Unit): 0.43300
The trip cost of USD 200 is first converted to miles using the Taxi Rate of USD 2.00 per mile from the emissions factor record. The number of miles from the above factor is thus 100 miles. This is multiplied by the Taxi Emissions (Kg CO₂e/Distance Unit) value from the emission factor record, which is 0.433.
Here’s how Net Zero Cloud automatically calculates ground travel emissions.
( Trip Cost / Taxi Rate for Distance Unit ) * Taxi Emissions (Kg CO₂e/Distance Unit)
= (200/2) * 0.433 = 43.30.
The application then divides this value by 1000 to get metric tonnes of carbon dioxide emissions (tCO₂e).
Scope 3 Emissions (tCO₂e) = 43.30/1000 = 0.0433 tCO₂e

Sam must also account for the carbon emissions associated with rental car trips. While creating a Rental Car Energy Use record, Sam adds the average fuel efficiency of the vehicle, the distance traveled, and the distance unit. If he obtains an aggregated value from rental car vendors for greenhouse gas emissions in metric tonnes of tCO₂e, he can directly enter the value in the Vendor-Provided Emissions (tCO₂e) field.

Net Zero Cloud comes with five records in Rental Car Emissions Factors, each specifying data for five different rental car size categories. So Sam can also add rental car travel categories specific to NTO.

Rental car emissions factors use Other Emissions Factor Set records to determine the emissions factors of the fuel used.

Net Zero Cloud first calculates the total fuel consumption in US Gallons and the distance in kilometers. Next, it translates the consumption of fuel to their related emissions. It does this by looking at the Other Emissions Factor Set Item record for the relevant fuel type where the emissions factors for CO₂, N₂O, and CH₄ are defined.

So Net Zero Cloud calculates emissions for CH₄, CO₂ and N₂O in kilograms. And then it applies the Global Warming Potential values of CH₄, and N₂O to convert the emissions to tCO₂e equivalents. Easy peasy!

Lastly, Sam concentrates on emissions from hotel stays. The hotel stay impact is evaluated in terms of the kilograms of CO₂e emissions per night.
The Hotel Stay Emissions Factor records have predefined emissions values averaged by country.

The fields used in the calculation from Hotel Stay Energy Use records are Number of Nights and Number of Rooms.

Hotel Stay Emissions Calculations
Sam logs the following data on a Hotel Stay Energy Use record.
- Number of Rooms: 2
- Number of Nights: 5
The United States - DEFRA 2019 emissions factor specifies Hotel Stay Emissions (kg CO₂e/Night) as 21.40.
The total emissions as calculated is 21.4 * 5 * 2 = 214 kg CO₂e. We then divide this by 1000 to get metric tonnes of carbon dioxide emissions (tCO₂e).
Scope 3 Emissions (tCO₂e) = 214/1000 = 0.2140 tCO₂e

- Salesforce Help : Create a Scope 3 Emission Source Record
- Salesforce Help : Create an Air Travel Energy Use Record
- Salesforce Help : Create a Ground Travel Energy Use Record
- Salesforce Help : Create a Rental Car Energy Use Record
- Salesforce Help : Create a Hotel Stay Energy Use Record
- Salesforce Help : Create an Air Travel Emissions Factor Record
- Salesforce Help : Create a Ground Travel Emissions Factor Record
- Salesforce Help : Create a Rental Car Emissions Factor Record
- Salesforce Help : Create an Other Emissions Factor Set Record
- Salesforce Help : Create a Hotel Stay Emissions Factor Record
- Developer Guide : Net Zero Cloud Calculations
- Get personalized recommendations for your career goals
- Practice your skills with hands-on challenges and quizzes
- Track and share your progress with employers
- Connect to mentorship and career opportunities
The Business Travel Carbon Footprint: Spend-Based Measurement and Benchmarking Exercise
Journal Title
Journal issn, volume title, repository usage stats.
In the face of inadequate international governmental action to prevent climate change, many multinational companies have begun to measure and reduce greenhouse gas (GHG) emissions from Scope 1, 2, and, less commonly, Scope 3 sources. This project considers a Scope 3 GHG emissions source, business travel. The GHG Corporate Protocol defines the activities producing GHG emissions from business travel as Scope 3 Category 6 carbon sources. Air travel represents the fastest-growing source of global GHG emissions, with up to 20% driven by business travel. With increasing awareness of these environmental costs, added to shifting perceptions of travel due to COVID-19, and continued improvement in virtual meeting technology, many organizations are assessing and reconsidering their business travel carbon footprints. On behalf of one such company (“The Client Company”) which is an international manufacturing business, this study totaled the expenses resulting from GHG Protocol identified travel activities and non-emissions producing travel activities. Business travel expenses from the years 2019 and 2020 were compared to highlight potential cost savings from a minimized travel scenario approximated by the COVID-19 pandemic. Using these travel expense accounts, a beginner tier spend-based carbon footprint was calculated for company-wide business travel in 2019 and 2020. To provide context for The Client Company, a peer benchmarking review was performed to identify business travel practices among similar companies and to identify innovative business travel practices.
Key findings include:
- Business travel expenses decreased by 80% between 2019 and 2020, while sales and headcount remained essentially constant (less than 2% variation).
- The business travel carbon footprint decreased by 80% between 2019 and 2020, with almost 80% of the carbon footprint resulting from air travel. The business travel carbon was underestimated, especially for passenger car travel, due to the challenges of collecting car mileage and/or expense data. Business-related restaurant meals, which are not included elsewhere in the GHG Protocol, would have contributed more than 6% to the overall business travel carbon footprint.
- Business travel carbon footprint reducing activities can be categorized from most beneficial to least beneficial as follows: a) Travel volume-reducing AND GHG emissions-reducing AND cost-reducing (e.g., choosing to meet virtually rather than traveling to a meeting); b) Travel volume-maintaining with different choices AND GHG emissions-reducing AND neutral to higher cost (e.g., selecting an electric rental car rather than a fossil fuel-powered rental car); c) Travel volume-maintaining AND GHG emissions-reducing AND higher cost (e.g., buying carbon offsets).
Key recommendations include:
- Carefully consider the opportunity cost of focusing on business travel as a manufacturing company.
- Aim for complete and easy travel data collection through travel providers.
- When implementing business travel carbon footprint lowering initiatives due to cost considerations, companies benefit most from travel reducing strategies, followed by cleaner travel activities, followed lastly by targeted carbon-reducing strategies.
Description
Quisel, Anna (2022). The Business Travel Carbon Footprint: Spend-Based Measurement and Benchmarking Exercise . Master's project, Duke University. Retrieved from https://hdl.handle.net/10161/24893 .
Collections

Dukes student scholarship is made available to the public using a Creative Commons Attribution / Non-commercial / No derivative (CC-BY-NC-ND) license .
- PersefoniAI
Resources
- Sign up free Sign in
Scope 3 Emissions: A Guide to Categories, Accounting, and More
- Scope 3 emissions are indirect greenhouse gas (GHG) emissions that occur as a result of an organization's activities but are outside of its direct operational control. These emissions represent the entire life cycle of a product or service, including emissions from suppliers, customers, and other stakeholders in the value chain.
- Scope 3 emissions typically represent the largest portion of an organization's total emissions, as they account for the indirect emissions associated with its entire value chain.
- Managing and reducing scope 3 emissions often requires collaboration and engagement with suppliers , customers, and other stakeholders throughout the supply chain.
Scope 3 emissions refer to indirect emissions that occur throughout a company's value chain, including both upstream and downstream activities. These emissions are a result of the company's activities but occur from sources not owned or controlled by the company. Scope 3 emissions are considered to be the most significant and challenging emissions category to measure and manage.
Scope 3 is one of three emissions streams defined by the Greenhouse Gas Protocol (GHGP) . Scope 1 covers emissions that directly result from operations owned or controlled by a reporting organization. Scope 2 emissions are the emissions associated with the generation of purchased energy, such as electricity. Scope 2 emissions technically are “indirect” emissions because they occur at the electricity provider’s or utility’s facilities, but they sit in their own category because they come from activities that the company does have control over, like how much energy they use and whether they purchase renewable energy.
Scopes 1 and 2 can be easier to measure since information is typically more readily available to the reporting company (e.g., utility bills). In contrast, scope 3 emissions can be more difficult to measure and manage, because they are generated by third parties that the company has varying degrees of influence over.
Organizations must work with all entities along their supply chain to gather scope 3 data — ranging from suppliers to customers. To make things even more complex, scope 3 is typically the largest category of emissions for most companies. For example, these emissions make up over three-quarters of Amazon’s total emissions .
We created this overview to break down the main points of this complex scope. Our guide goes over categories, reporting guidance, and other things you should know when looking to calculate scope 3 emissions. You can also learn more from the GHG Protocol’s official website .
How Can Organizations Measure Scope 3 Emissions?
Organizations can begin measuring their scope 3 emissions by using spend-based activity data, secondary data (like industry averages), internal data on their purchases, or a combination of these and other available data. As more organizations begin to develop the inventories of their GHG emissions, reporting entities can gradually increase the use of more precise primary data rather than relying on secondary data.
The GHGP provides guidance for each scope 3 category to help organizations understand what methods are best suited for their available data and resources.
Reporting organizations can also turn to additional industry-specific guidance built on the GHGP, like the Partnership for Carbon Accounting Financials’ (PCAF) Standard for financed emissions.

Examples of Companies Measuring Scope 3 Emissions
Apple is one large company that’s already started measuring its scope 3 emissions. They enlisted help from Fraunhofer IZM to verify their scope 3 emissions in recent reports. In their most recent report, Apple found that 98% of its carbon footprint is made up of scope 3 emissions from the creation, use, and disposal of its products.
PepsiCo also measures scope 3 emissions , and is striving to reduce its absolute indirect value chain (scope 3) by 40% by 2030 (against a 2015 baseline). Part of their climate mitigation strategy includes developing efficient and alternative solutions in transportation and distribution, as well as shifting to renewable electricity and fuels in manufacturing and fleet. PepsiCo will also engage with its suppliers and value chain partners to reduce emissions in their operations and beyond.
What Are the Scope 3 Categories?
Scope 3 covers 15 total categories, further broken down into upstream and downstream emissions . The GHGP created these categories to provide organizations with more guidance and structure when reporting on the many emissions that fall under this scope. The categories and guidance also help avoid double-counting within an organization’s own footprint and support consistent and comparable reporting.
Organizations are only required to report on categories if they’re relevant to them. For example, a company producing a product sold to final consumers would not have emissions from the intermediate processing of sold products (category 10). A best practice is to include explanations for any categories deemed not relevant. For the above example this would look like:
Emissions from scope 3 category 10: processing of sold product are considered not relevant for our company because it sells a final product that does not undergo any additional processing prior to being sold to the end user.
Below, we’ll go over each scope 3 emissions category in more detail.
Upstream Activities
Upstream activities cover emissions created by an organization’s purchases to provide their goods and services and support day-to-day operations. This can range from services, like an outsourced IT team, to tangible assets, like purchased materials.
The GHGP organizes the following categories under upstream activities.
Category 1: Purchased Goods and Services
This category covers emissions from the production of all purchased or acquired products and services not covered in categories 2 to 8. Since it can encompass many purchases, organizations can group them further by use: production-related (like parts for their product), also referred to as direct purchasing, and non-production-related (like HR software), also referred to as indirect purchasing.
Category 2: Capital Goods
Category 2 includes emissions from the production of purchased or acquired capital goods. The GHGP defines capital goods as final products with extended life that are used to:
- Provide a service
- Deliver, sell or store merchandise
- Produce a product
Since organizations may categorize assets differently, the GHGP lets reporters determine what goods fall under category 1 and category 2, but organizations should not double-count.
The GHGP also requires organizations to account for the cradle-to-gate emissions in the year they’ve acquired capital assets, similar to how they’d account for category 1 emissions. This may differ from how organizations normally amortize, depreciate or discount capital goods over time in financial accounting.
Category 3: Fuel- and Energy-Related Activities
Category 3 covers emissions from fuel- and energy-related activities that aren’t covered in scopes 1 and 2. “Energy” in this case refers to electricity, cooling, heating and steam.
This category covers the following fuel- and energy-related activities:
- Upstream emissions of purchased energy or fuels, meaning the transportation, creation, and extraction of fuels consumed by the reporting company or fuels consumed in the generation of energy that is used by the reporting company
- Transmission and distribution (T&D) losses , meaning the generation of energy that’s consumed by a T&D system
- Generation of purchased electricity sold to end users, meaning the generation of energy (including upstream emissions and combustion) purchased by the reporting organization and sold to end users - reported by the utility company or energy retailer
This category does not cover emissions from the combustion of the fuel and energy consumed by the organization, since these are covered in scopes 1 and 2.
Category 4: Upstream Transportation and Distribution
This category looks at emissions generated from third-party transportation and distribution services paid for by the reporting company. This can include the emissions generated to transport supplies between warehouses and from the storage of goods in warehouses or distribution centers.
Category 5: Waste Generated in Operations
Category 5 looks at emissions created by the third-party treatment and disposal of waste from a company’s controlled or owned operations. This covers all future emissions from waste and includes both wastewater and solid waste. Emissions from category 5 can optionally include the transportation of waste from the reporting company to the waste vendor. These emissions include the scope 1 and scope 2 emissions of an organization’s third-party waste management company(s), when available.
Category 6: Business Travel
This category covers emissions generated from employee transportation for business-related activities in third-party-owned or operated vehicles that are not for day-to-day commuting.
Organizations also have the option to include emissions from hotels.
This category does not cover the following emissions:
- Travel in vehicles owned or controlled by the organization since this is covered in scope 1
- Employee commuting, since this is covered in scope 3, category 7
- Travel in leased vehicles, since this is covered in scope 3, category 8
Category 7: Employee Commuting
Category 7 covers emissions from employee commutes between their workplace and home.
Organizations can also include emissions generated from remote work if it is anticipated to be significant or they have had structural changes transitioning from in-office working to remote working.
Category 8: Upstream Leased Assets
This category looks at emissions from the operation of assets the reporting organization leases from other organizations in the reporting year and not yet included in the reporting organization’s scope 1 or scope 2 inventories. Organizations will include the lessor’s scope 1 and 2 emissions in their emissions for the leased asset.

Downstream Activities
Downstream activities look at how emissions created as goods and services make their way from the organization’s operations to the end user. These activities can range from product distribution to retailers to customers’ product disposal.
The GHG Protocol organizes the following categories under downstream activities.
Category 9: Downstream Transportation and Distribution
Category 9 focuses on emissions generated from transportation and distribution services paid for by the company’s customers - whether that’s a downstream intermediate customer (e.g. Final manufacturer or wholesaler) or the final end customer.
Organizations that sell an intermediate product should report on the transportation and distribution from the point of sale to either the end-user or the business customer when that transportation is paid for by the downstream entity.
Organizations can also optionally include emissions from storage and retail customer travel to and from stores.
Category 10: Processing of Sold Products
This category looks at emissions created when third parties process sold intermediate products following the sale by the reporting organization. Intermediate products are goods integrated into another product before use or used to produce another product, like paint or wood used to craft a dining table.
Organizations will include scope 1 and 2 emissions from downstream value chain entities involved in the process of these emissions. Since organizations don’t always know the end use of their products, the GHGP provides guidance for calculating scope 3, category 10 emissions in this scenario. The GHGP encourages organizations to pick a method based on their ability to collect data from partners and on their own business goals.
Category 11: Use of Sold Products
Category 11 focuses on emissions created from sold services and goods by the reporting organization. It encompasses the expected lifetime emissions for all relevant products across an organization’s product portfolio for all products sold during the reporting year.
This category further divides sold products into two types:
- Direct use-phase emissions (required) include products that directly consume fuel or energy during use and GHG and products that form or contain GHG that are emitted during use
- Indirect use-phase emissions(encouraged if they’re expected to be significant) include products that indirectly consume energy or fuel during use
Organizations reporting on avoided emissions must report separately from their scope 1, 2, and 3 inventories.
Category 12: End-of-Life Treatment of Sold Products
This category looks at emissions from waste treatment and disposal of sold products at the end of their life cycle. That includes the total expected end-of-life emissions from all products sold during the reporting year.
For sold intermediate products, organizations should account only for the emissions associated with the intermediate product at the end of life, and not for the final product it helped create.
Calculating these emissions requires assumptions about consumers' end-of-life treatment since it’s difficult to know how consumers will dispose of products. Organizations should report on these assumptions and methods used to calculate these emissions.
Category 13: Downstream Leased Assets
Category 13 covers emissions generated from the operation of owned or leased assets leased or subleased to other entities that aren’t included in scopes 1 or 2.
The GHGP acknowledges that it may not be valuable to differentiate assets that are leased (category 13) and sold (category 11) to customers. In this case, the GHGP recommends reporting these emissions under category 11 instead of category 13 to avoid double-counting.
Category 14: Franchises
This category encompasses emissions from franchise operations. This is applicable for franchisors and includes scope 1 and 2 emissions from franchisees.
Scope 3 emissions from the franchisee can optionally be included if they are anticipated to be significant. Franchisors can also choose to include their franchisees’ scope 3 emissions under category 1 depending on the purchasing model.
Category 15: Investments
Category 15 emissions are also called financed emissions and cover emissions associated with investments. This category is mainly for financial institutions, but it’s relevant for all other organizations with investments.
This category is broken into four types:
- Project finance
- Debt investments
- Managed investments and client services
- Equity investments
Emissions should be allocated based on the organization’s share of investment in the investee. Since portfolios can change over time, organizations should either choose a fixed point in time or use a representative average from the reporting year.
Organizations can look to the GHGP’s guidance on category 15 emissions along with guidance from the Partnership for Carbon Accounting Financials (PCAF) for further information on calculating financed emissions.

Are These Emissions Regulated?
Scope 3 emissions are voluntary under the GHGP, but carbon disclosure mandates vary between countries and other governing entities. For example, the U.S. Securities and Exchange Commission (SEC) has proposed rules that would require certain larger companies to include scope 3 emissions in their climate-related disclosures . The Science Based Targets initiative (SBTi) requires companies to cover scope 3 if scope 3 makes up more than 40% of their overall emissions.
Does Net Zero Include Scope 3?
Reaching Net Zero should consider an organization’s entire value chain of emissions, including those generated by suppliers and end-users (scope 3). Rapid and significant cuts in value chain emissions are a core focus of the Net Zero standard and must be the ultimate priority for organizations. Most organizations will require deep decarbonization of 90-95% to reach net zero under the Standard.
How Can Reporting Organizations Reduce Scope 3 Emissions?
Organizations can reduce their scope 3 emissions by prioritizing their highest-impact reductions. In the meantime, they can work with suppliers and other stakeholders to look for opportunities to reduce emissions along their value chain. Here are some of the steps they can take to start lowering their scope 3 emissions:
- Engage suppliers to encourage them to measure and reduce emissions; Prioritize working with suppliers and vendors who are taking actions to reduce their carbon footprint.
- Prioritize collecting more easily accessible and collectible data and progressively work to gain more granularity for all Scope 3 data.
- Work with customers and retailers to invest in R&D to reduce emissions for product usage and disposal.
- Engage with industry working groups to advance emissions data and help improve methodologies, tools, and other resources. For example, the Sustainable Apparel Coalition and Higg Co. provide apparel-specific accounting guidance, collect supplier data, and maintain an EF database.
Reduce emissions within your control , like those associated with business travel, commuting, and waste generation.
Do Scope 3 Emissions Include Double-counting?
The GHGP’s scope 3 guidance is flexible to help organizations avoid double-counting between categories within their own inventory.
For example, some purchases may not clearly fit into category 1 or category 2. It’s up to the discretion of that organization to categorize their emissions, but they must not double-count between categories.
Organizations can work on avoiding double-counting in their own inventory by familiarizing themselves with categories and assigning ambiguous emissions to a single category. If organizations determine that double-counting in their own inventory is inevitable, they should include an explanation in their disclosure.
Double counting across organizations and value chains is also a consideration, but is complex and should not be used as justification for excluding emissions from an organization’s own inventory unless it is mandated by a reporting requirement.
How To Start Reducing Scope 3 Emissions
Energy (75.6% of emissions or 37.6 GtCO2e), agriculture (11.6% of emissions or 5.8 GtCO2e), and industrial processes (6.1% of emissions or 3.1 GtCO2e) have the highest overall emissions according to the World Resources Institute (WRI) .
The WRI says that reducing large emissions sources is a great place to start, but change is necessary for all sectors. This includes actions like phasing out coal in electricity generation.

Why Should Organizations Manage These Emissions if They’re Not Required?
Organizations should manage scope 3 emissions to make the highest impact possible when reducing their carbon footprint while also improving their operations. Many investors, shareholders, and customers are increasingly demanding this information.
There are many tangible financial and long-term business benefits organizations can gain from managing their scope 3 emissions. Below are a few opportunities that can open up:
- Meet or get ahead of mandated emissions requirements
- Build trust and transparency with investors, customers, employees, and other stakeholders
- Improve efficiency and lower costs with operations, products, and services. Taking scope 3 into account helps companies understand their value chain from a system’s perspective, unlocking opportunities for better design and collaborative innovation with suppliers.
On a larger scale, tackling scope 3 emissions helps organizations play their part in limiting global warming. Rising temperatures are a global issue that requires everyone’s participation. Although measurement is difficult, it’s still doable with the right tools in place and buy-in from your team.
Finding the right carbon management platform is the easiest way to automate as much as possible and move away from manual measurement.
See how you can use Persefoni’s all-in-one carbon accounting platform to measure and disclose your scope 3 emissions.
Summary: Unpacking Scope 3 Emissions [Infographic]

Get the latest updates straight to your inbox
Sign up for our newsletter and stay ahead of the curve. with every edition, you'll receive the latest news, updates, and insights from our experts, straight to your inbox., related articles.

Getting to Know Persefoni: Meet Eliana Cameira

Scope 2 Emissions: An Explainer Guide
.png)
The 10 Best Carbon Accounting Software in 2024

An official website of the United States Government
- Kreyòl ayisyen
- Search Toggle search Search Include Historical Content - Any - No Include Historical Content - Any - No Search
- Menu Toggle menu
- INFORMATION FOR…
- Individuals
- Business & Self Employed
- Charities and Nonprofits
- International Taxpayers
- Federal State and Local Governments
- Indian Tribal Governments
- Tax Exempt Bonds
- FILING FOR INDIVIDUALS
- How to File
- When to File
- Where to File
- Update Your Information
- Get Your Tax Record
- Apply for an Employer ID Number (EIN)
- Check Your Amended Return Status
- Get an Identity Protection PIN (IP PIN)
- File Your Taxes for Free
- Bank Account (Direct Pay)
- Payment Plan (Installment Agreement)
- Electronic Federal Tax Payment System (EFTPS)
- Your Online Account
- Tax Withholding Estimator
- Estimated Taxes
- Where's My Refund
- What to Expect
- Direct Deposit
- Reduced Refunds
- Amend Return
Credits & Deductions
- INFORMATION FOR...
- Businesses & Self-Employed
- Earned Income Credit (EITC)
- Child Tax Credit
- Clean Energy and Vehicle Credits
- Standard Deduction
- Retirement Plans
Forms & Instructions
- POPULAR FORMS & INSTRUCTIONS
- Form 1040 Instructions
- Form 4506-T
- POPULAR FOR TAX PROS
- Form 1040-X
- Circular 230
Understanding business travel deductions
More in news.
- Topics in the News
- News Releases
- Multimedia Center
- Tax Relief in Disaster Situations
- Inflation Reduction Act
- Taxpayer First Act
- Tax Scams/Consumer Alerts
- The Tax Gap
- Fact Sheets
- IRS Tax Tips
- e-News Subscriptions
- IRS Guidance
- Media Contacts
- IRS Statements and Announcements
IRS Tax Tip 2023-15, February 7, 2023
Whether someone travels for work once a year or once a month, figuring out travel expense tax write-offs might seem confusing. The IRS has information to help all business travelers properly claim these valuable deductions.
Here are some tax details all business travelers should know
Business travel deductions are available when employees must travel away from their tax home or main place of work for business reasons. A taxpayer is traveling away from home if they are away for longer than an ordinary day's work and they need to sleep to meet the demands of their work while away.
Travel expenses must be ordinary and necessary. They can't be lavish, extravagant or for personal purposes.
Employers can deduct travel expenses paid or incurred during a temporary work assignment if the assignment length does not exceed one year.
Travel expenses for conventions are deductible if attendance benefits the business. There are special rules for conventions held outside North America .
Deductible travel expenses include:
- Travel by airplane, train, bus or car between your home and your business destination.
- Fares for taxis or other types of transportation between an airport or train station and a hotel, or from a hotel to a work location.
- Shipping of baggage and sample or display material between regular and temporary work locations.
- Using a personally owned car for business.
- Lodging and meals .
- Dry cleaning and laundry.
- Business calls and communication.
- Tips paid for services related to any of these expenses.
- Other similar ordinary and necessary expenses related to the business travel.
Self-employed individuals or farmers with travel deductions
- Those who are self-employed can deduct travel expenses on Schedule C (Form 1040), Profit or Loss From Business (Sole Proprietorship) .
- Farmers can use Schedule F (Form 1040), Profit or Loss From Farming .
Travel deductions for the National Guard or military reserves
National Guard or military reserve servicemembers can claim a deduction for unreimbursed travel expenses paid during the performance of their duty .
Recordkeeping
Well-organized records make it easier to prepare a tax return. Keep records such as receipts, canceled checks and other documents that support a deduction.
Subscribe to IRS Tax Tips
6 Cheapest Business Class Airlines for an Affordable Upgrade
By Jessica Puckett

All products featured on Condé Nast Traveler are independently selected by our editors. However, when you buy something through our retail links, we may earn an affiliate commission.
With the ever-shrinking seats in coach class, the allure of those spacious front-of-plane cabins has never been stronger. Flying business class can feel reminiscent of the golden era of travel, when glamour and comfort ruled the skies. Perks like lie-flat beds, privacy doors that encapsulate seats, airport lounge access, and even chauffeur services can entice even the most austere travelers among us to contemplate splurging on an upgrade every now and then.
Of course, those amenities all come at a price. Business class fares can be prohibitively expensive for the average traveler, with one-way tickets soaring as high as several thousands dollars. But did you know that the cheapest business class airlines offer many of the best perks for less money? If you know the right carriers, an affordable but luxurious business class ticket could be within reach. Here’s everything you need to know about the cheapest business class airlines .
What perks and amenities do the cheapest business class airlines give you?
On board a cheap business class airline that still offers good value, you can expect a spacious seat—one that lies flat on longer routes—better in-flight meals, complimentary alcohol, and reserved overhead bin space.
Other perks on the ground will vary from airline to airline. Some carriers “unbundle” their cheapest business class fares, meaning amenities like airport lounge access , seat selection, and over-the-top perks like chauffeur services aren’t offered to keep prices lower. Other airlines simply do not offer any customers amenities like lounges at all.
To get the cheapest business class fares, you’ll have to decide what perks are most important to you. Would you prefer to relax in a lounge during a long layover? Or is an affordable bed in the sky with fully closing doors of more importance? The airlines below all offer luxury, but the emphasis is put on different stages of the travel experience.
What prices are considered affordable for business class?
The price for that premium seat can get quite steep: Flights in top business class cabins can cost anywhere from $5,000 to $10,000. Like other airline tickets , the price of cheap business class fares can depend on the destination, time of year, when you book, and the airline itself. The longer the flight and the plusher the cabin, the higher the fare will climb.
However, according to recent data from aviation statistics firm Cirium , The average business class fare in 2023 was $1,845. So anything near or below that price point can be considered a pretty good deal for one-way in business class—keeping in mind the factors like the length of the flight and the amenities your ticket includes.
6 of the cheapest business class airlines

TAP Air Portugal business class tickets can occasionally be found for under $2,000 roundtrip.
TAP Air Portugal
Generally known as a budget carrier, TAP Air Portugal actually offers a solid—and affordable—business class product as well. According to Katy Nastro, travel expert at Going.com , TAP Air Portugal routinely prices its business class seats to Europe for less than $3,000 roundtrip—sometimes even slipping below $2,000 roundtrip. For that price, you’ll get lie-flat seats with bedding that includes wrap-around duvets and large pillows, as well as meal service that features Portuguese dishes and wines. The seats and finishes might not feel as plush as other business classes, but you’ll have space to stretch your legs and lie flat at an attainable price point.
Turkish Airlines
Offering a few more amenities but still cheaper rates in business is Turkish Airlines, a carrier that Nastro says also consistently offers seats in business class on flights to Turkey and other destinations in Europe for under $3,000 roundtrip. You’ll be well cared for in Turkish business class, which offers a lie-flat seat that’s more than six feet long and up to two feet wide, with an 18-inch entertainment screen. When it comes to dining, you’ll have access to the airline’s iconic flying chefs, who prepare a litany of Turkish dishes and other cuisines mid-flight and essentially transform the business class cabin into a flying, top-tier restaurant. Plus, business class passengers also have access to Turkish lounges when they arrive at the airport.

Emirates' most affordable business class option doesn't include perks like lounge access or seat selection.
Emirates “Special” business class fares
In order to give customers access to the cheapest business class seats, Emirates unbundles its business class fares. If you book one of these tickets, called “Special" business class fares by the airline, you won’t have access to Emirates lounges , chauffeur service, seat selection, or upgrades to first class. But once onboard the plane, you get all those bells and whistles Emirates business class is known for: ultra-comfy beds, gourmet food, premium cocktails, and even the A380’s onboard cocktail lounge.
Using the unbundled booking method can potentially save travelers thousands of dollars. A quick check of business class fares on Emirates’ New York to Dubai route for June 2024 showed the airline’s Special business class price at $2,787 one-way, while its Flex Plus business class ticket, which offers the most perks and rebooking options, clocked in at $6,229—a difference of more than $3,400. The Special fares are only available on certain routes and certain times of year, so if you see one that works for you, it could be worth locking in.
This little-known German carrier flies from 13 major US gateways to Europe, and is one of the best cheapest business class airlines out there. Condor’s sharp-looking business class cabins with striped accents offer seats that transform into a 6.5-foot lie-flat bed, 4K entertainment screens, and direct-aisle access for every passenger. Plus, each business class passenger gets access to Condor’s lounges. Fares start at about $1,100 on flights from New York to Berlin.

Qatar Airways’ Business Class Lite option is a more affordable way to book one of the best seats in the sky.
Qatar Airways Business Class Lite
Much like Emirates’ unbundled tickets, Qatar Airways’ Business Class Lite and Business Class Classic fares offer the same opulent seats to fliers who’d like to shave off a few amenities in order to save money. You won’t have lounge access or seat selection before check-in included in your ticket. But you can book into the revered Qsuites product, which offers fully closing doors around a spacious lie-flat seat (79 inches long and 21 inches wide) and impeccable in-flight service. While the price tag can’t be considered “cheap” compared to some carriers, the unbundled fares can be a more affordable way to book one of the best seats in the sky. The unbundled fares aren’t offered on all routes, but a search of Qatar’s flights from New York to Doha for August 2024 shows Business Class Classic fares for $6,268, while Business Elite is $8,810—a difference of more than $2,500.
JetBlue Mint
Although it’s not offered on every plane or every route, JetBlue’s Mint business class is among the best premium products in terms of value for the money. Mint offers a mix of standard lie-flat seats and more private suites with doors, depending on the aircraft layout. Each seat offers adjustable firmness, a massage function, and turns into a bed that’s six feet, eight inches long outfitted with blankets and pillows from Tuft and Needle. You can also expect some seriously scrumptious food and drink options, as JetBlue has partnered with New York restaurant group Delicious Hospitality, the collective behind Manhattan restaurants Pasquale Jones, Charlie Bird, and Legacy Records, to design the rotating menus in Mint. One-way tickets start at about $700 and range up to $2,000 to fly between New York and Los Angeles, but expect to pay more on JetBlue’s international routes.
By signing up you agree to our User Agreement (including the class action waiver and arbitration provisions ), our Privacy Policy & Cookie Statement and to receive marketing and account-related emails from Traveller. You can unsubscribe at any time. This site is protected by reCAPTCHA and the Google Privacy Policy and Terms of Service apply.
Amazon Prime Day 2024: Here's what to expect, tips, and tricks
When you buy through our links, Business Insider may earn an affiliate commission. Learn more
Amazon Prime Day has grown into one of the biggest sales events of the year, with discounts rivaling those of Black Friday and Cyber Monday. With so many retailers selling on Amazon, Prime members can save on just about anything, from viral beauty products to new unlocked smartphones.
The best Prime Day deals we saw last year included all-time lows on brands like Apple, Vitamix, iRobot, Dyson, Crocs, and, of course, Amazon-owned products like the Fire TV , Kindle e-reader , and Echo smart speakers . We expect to see more of the same this year as well.
It'll be the first major deal holiday of the year, so it's an awesome chance to score summer discounts on big-ticket items and household staples. The retailer's 10th Prime Day event has officially been announced to arrive in July, but the actual days are still unknown. In the meantime, we're keeping tabs on all of the latest Prime Day news, and we'll keep you updated with our findings here.
- Shop the latest deals at Amazon
When is Amazon Prime Day 2024?
Amazon Prime Day is officially coming this July, though the exact days have not yet been announced. In past years, it kicked off on the second Tuesday of the month. If Amazon follows the same trend, it will take place on July 9 and 10. We'll keep this story updated as more details are announced.
What is Amazon Prime Day?
Amazon Prime Day is the retailer's annual mega sale and one of the major benefits of Prime membership. It's a two-day sales event, usually during the summer, that features products from every category, from fashion staples to hot new tech.
Though it used to be a deal holiday of a much smaller scale, Prime Day has grown exponentially since the first one in 2015. Now, you can find almost everything on sale for all-time low prices, matching discounts we see during Black Friday and Cyber Monday.
What should I buy during Amazon Prime Day?
Everything is fair game to buy during Amazon Prime Day. Whether you've been holding out on a pricey new TV or just need to stock up on toiletries, Prime Day is a good time to make your move.
Last year, we saw incredible prices on tech, including 4K TVs , Fire TV streaming devices , Apple products, Kindle e-readers , PC gaming accessories, Echo smart speakers , and top headphones picks. Prime Day tech deals featured brands like Logitech, Bose, Jabra, Sony, Roku, Samsung, TCL, and more.
If you're looking for style and beauty deals during Prime Day, last year, brands like Tommy Hilfiger, Tatcha, Laneige, Levi's, Carhartt, Anastasia Beverly Hills, Adidas, and Marc Jacobs all featured products at rare low prices. That means skincare, makeup, shoes, men's clothing, women's fashion, and accessories will all be available for less.
Home and kitchen products saw no shortage of Prime Day deals either, with big names like Dyson, Shark, iRobot, Philips, KitchenAid, Nespresso, Casper, Leesa, and OXO down to all-time lows for the event. So, whether you need an air fryer , robot vacuum , mattress , or just some sturdy mixing bowls, Prime Day is a good time to buy.
You don't need to be focused on fancy new gadgets or treatments to shop smart during Amazon Prime Day either. We also catch tons of affordable household essentials available for even less every year, like toilet paper, dish soap, doggy bags, and makeup wipes. These deals are sweet, since they save you money on stuff you needed to buy anyway.
How long do Prime Day deals last?
How long a Prime Day deal lasts differs between items, but in general, the best discounts will start during the event and end before the 48-hour holiday is over. Some will last the whole two days while others will only last one, so it's always wise to act on a good sale when you see it. Lightning deals especially go fast, the most popular of which dwindle away in less than an hour.
I always recommend buying a product you've had your eye on as soon as it's highlighted as a Prime Day deal. Regardless of how long it's set to last, oftentimes the best sales run out of stock, resulting in shipping dates being pushed out, or the deal no longer being offered at all. We'll be providing all of the deal context you need to shop confidently and quickly, so be sure to check our roundups of the best discounts when the event rolls around.
Do you need to be a Prime member to shop Amazon Prime Day?
Amazon Prime Day is locked to Prime members only. It's one of the major benefits of subscribing to the service, in addition to other perks like free two-day shipping and Prime Video streaming.
If you have yet to become a member, you can sign up for a free 30-day trial to test it out. Once the official Prime Day dates have been announced, you can even time your free period to overlap with the sale, but it's not a guarantee since sometimes retailers will lock out free members from shopping the best deals.
Do other stores participate in Prime Day?
Although Prime Day is an Amazon-specific event, it's grown so large that other major retailers have started kicking off competing sales to overlap with it. No one has announced a competing Prime Day sale just yet, but if past years are any indication, Walmart, Target, and Best Buy will likely be holding their own events.
These are definitely worth checking out; they often match the best deals on popular items you can find from Prime Day. We'll also be rounding these deals up so you can shop from the retailer that best suits you, whether you're a Target Circle cardholder, My Best Buy Plus member, or Walmart Plus subscriber.
Is Prime Day an international event?
Prime Day occurs in several other countries, but not all of them. Here's a list of countries where Prime Day will be available to shop:
- Netherlands
- Saudi Arabia
- The United Arab Emirates
- The United States
- The United Kingdom
Want to see what Amazon has on sale right now? We've spotted some hefty price cuts on electronics, fashion, home, kitchen, laptops, and more on its main deals page .
- Main content
IMAGES
VIDEO
COMMENTS
6 Category 6: Business Travel TCategory description his category includes emissions from the transportation of employees for business-related activities in vehicles owned or operated by third parties, such as aircraft, trains, buses, and passenger cars.
6. Business travel. Select one of the buttons below to enter your scope 3 category 6 data. There are two options: Business travel & study abroad (distance traveled), and Purchasing data (dollars or MT eCO2). Business Travel & Study Abroad (distance traveled) Air travel paid for by the institution is required for Second Nature signatories.
travelservices.This report focuses on category 6 of Scope 3 emissions as defined by the Greenhouse Gas Protocol for Business Travel (Scope 3.6). Methodology This benchmarking exercise involved interviews with a dozen sustainability leads from global companies relying on business travel to successfully conduct their business.
6. Business travel Transportation of employees for business-related activities during the reporting year (in vehicles not owned or operated by the reporting company) The scope 1 and scope 2 emissions of transportation carriers that occur during use of vehicles (e.g., from energy use) Optional: The life cycle emissions associated with
Business travel emissions, classified under Scope 3 Category 6 in the GHG Protocol, specifically about the indirect greenhouse gas (GHG) emissions originating from transportation activities undertaken by employees for business-related purposes, excluding commuting.These activities encompass a wide range of transport modes, including air travel, rail travel, vehicle rental, and the use of ...
Business travel involves the transportation of employees for work-related activities. Most of these vehicles are not owned or controlled by the company that reports the emissions. These emissions are classified as scope 3, category 6 (Business travel). However, there are some exceptions to this rule. If the company owns or controls the vehicles ...
"downstream transportation and distribution" or for scope 3 category 6 "business travel" emissions Business air travel targets are generated using the absolute contraction method with a linear annual reduction rate of 0.4% (the sector decarbonization rate for 2019-2050)
Business travel (category 6): Table 10; GHG Emission Factors Hub (April 2022) (epa.gov) Categories 8 and 13: Upstream and downstream leased assets. Upstream and downstream leased assets can be calculated by using energy or fugitive emissions data from a leased asset. For Upstream leased assets (Category 8), these emissions would be from an ...
For all transport-related emissions (i.e., those in Scope 3 category 4: "Upstream transportation and distribution", category 6: "Business travel", category 7 "Employee commuting" and category 9: "Downstream transportation and distribution"), indicate the life cycle stages covered in your calculation (e.g., Well-to-Wheel etc.).
Scope 3 Category 6. This blog will help you better understand how to report on the emissions that your staff generate when they're travelling for business vehicles you do not own.
Category 6: Business Travel. This category includes emissions from the transportation of employees for business-related activities in vehicles owned or operated by third parties, such as aircraft, trains, buses, and passenger cars. WRI uses the distance-based approach to estimate emissions from air and rail travel, by multiplying the distance ...
For example, category 4 (upstream transportation and distribution) has three methods: fuel-based, distance-based, and spend-based. ... For example, in the first year of reporting, an organization may only be able to track spend for business travel, but in subsequent years, miles traveled by type (air, rail, car) may be available. ...
More detail on the calculation methods for category 1 'Purchased goods and services', in particular the 'hybrid method' ... Category 6 - Business travel Date: April 2013. Size: 233.89 KB Category 7 - Employee commuting Date: April 2013. Size: 225.43 KB Category 8 - Upstream leased assets ...
Category 1: Purchased Goods & Services . The procurement, manufacturing, and delivery of goods and services obtained by your organization during the reporting year that do not fall under any of the categories 2-8. ... Category 6: Business travel . During the reporting year, your organization facilitated the transportation of its employees for ...
Scope 3 Category 6 BUSINESS TRAVEL addresses greenhouse gas emissions derived from the transportation used by employees related to business activities. This includes a wide range of transportation modes including auto, buses, trains, metro rail, aircraft and maritime unrelated to vehicles owned/controlled by the reporting entity, leased vehicles or employee commuting.
Scope 3 — Category 6: Business travel 1) Introduction Business travel represents any mode of transportation that is used by employees for business purposes and operated by a third party, excluding commuting. As it is directly influenced by our employees' travel choices, we have a high degree of control. By encouraging the use of low ...
The scope 3 emissions for one organization are the scope 1 and 2 emissions of another organization. Scope 3 emissions, also referred to as value chain emissions, often represent the majority of an organization's total GHG emissions. Scope 3 emissions fall within 15 categories, though not every category will be relevant to all organizations.
In 2019, business travel emissions comprised approximately 17% of Stanford's currently quantified total carbon footprint, and 22% of Stanford's currently quantified scope 3 emissions. The breakdown of Stanford's emissions in the business travel category between air travel, lodging, and ground transportation is illustrated in Figure 1 ...
The Greenhouse Gas Protocol released new standards meant to help organizations report their GHG emissions, including the environmental impact of business travel. Developed by the World Resources Institute and the World Business Council for Sustainable Development, the Corporate Value Chain (Scope 3) Standard includes guidance on how to calculate and track emissions from air travel, car rentals ...
The total emissions as calculated is 21.4 * 5 * 2 = 214 kg CO₂e. We then divide this by 1000 to get metric tonnes of carbon dioxide emissions (tCO₂e). Scope 3 Emissions (tCO₂e) = 214/1000 = 0.2140 tCO₂e. Phew! Sam's finally done calculating the emissions from business travel.
The GHG Corporate Protocol defines the activities producing GHG emissions from business travel as Scope 3 Category 6 carbon sources. Air travel represents the fastest-growing source of global GHG emissions, with up to 20% driven by business travel. With increasing awareness of these environmental costs, added to shifting perceptions of travel ...
Category 6: Business Travel. This category covers emissions generated from employee transportation for business-related activities in third-party-owned or operated vehicles that are not for day-to-day commuting. Organizations also have the option to include emissions from hotels. This category does not cover the following emissions:
Business travel deductions are available when employees must travel away from their tax home or main place of work for business reasons. A taxpayer is traveling away from home if they are away for longer than an ordinary day's work and they need to sleep to meet the demands of their work while away. Travel expenses must be ordinary and ...
Condor's sharp-looking business class cabins with striped accents offer seats that transform into a 6.5-foot lie-flat bed, 4K entertainment screens, and direct-aisle access for every passenger ...
The best Prime Day deals we saw last year included all-time lows on brands like Apple, Vitamix, iRobot, Dyson, Crocs, and, of course, Amazon-owned products like the Fire TV, Kindle e-reader, and ...