Aviation is responsible for 3.5 percent of climate change, study finds
- September 3, 2020
- Download Cover Image
New research that provides the most comprehensive calculations of aviation’s impact on the climate finds that global air travel and transport is responsible for 3.5 percent of all drivers of climate change from human activities.
The study, published in the journal Atmospheric Environmen t , evaluated all of the aviation industry’s contributing factors to climate change, including emissions of carbon dioxide (CO 2 ) and nitrogen oxide (NOx), and the effect of contrails and contrail cirrus – short-lived clouds created in jet engine exhaust plumes at aircraft cruise altitudes that reflect sunlight during the day and trap heat trying to escape at night.
The findings show that two-thirds of the impact from aviation is attributed to contrails, NOx, water vapor, sulfate aerosol gases, soot, and other aerosols. The remainder is due to the cumulative heat-trapping effects of long-lived CO 2 emissions – 32.6 billion tonnes between 1940 and 2018, or roughly the total global CO 2 emissions for the year 2010.
The five-year research effort was led by the UK’s Manchester Metropolitan University in collaboration with numerous academic and research institutions across the globe.
Co-author David Fahey, director of NOAA’s Earth System Research Laboratories in Boulder, Colorado, said the research strengthens the scientific foundation for understanding the role of aviation in climate change.
“Our assessment will aid decision makers and the industry in pursuing any future mitigation actions, while protecting this important sector from any inaccurate assertions concerning its role in the climate system,” Fahey said.
The study presents the complete first set of calculations for aviation based on a new metric introduced in 2013 by the Intergovernmental Panel on Climate Change called ‘effective radiative forcing,’ or ERF. ERF represents the increase or decrease in the balance between the energy coming from the sun and the energy emitted from the Earth since pre-industrial times.
Using the new ERF metric, the team found that while contrail cirrus has the largest climate warming impact, it is less than half that previously estimated. The effects of CO 2 emissions generated by aviation last for many centuries, and represent the second largest contribution. Approximately half the total cumulative emissions of CO 2 were generated in the past 20 years.
“Given the dependence of aviation on burning fossil fuel, its significant CO 2 and non-CO 2 effects, and the projected fleet growth, it is vital to understand the scale of aviation’s impact on present-day climate change,” said lead author David Lee, professor of Atmospheric Science at Manchester Metropolitan University and Director of its Centre for Aviation, Transport, and the Environment research group.
Lee said that estimating aviation’s non-CO 2 effects on atmospheric chemistry and clouds was a complex challenge. “We had to account for contributions caused by a range of atmospheric physical processes, including how air moves, chemical transformations, microphysics, radiation, and transport.”
The new study will allow aviation’s impact on climate change to be compared with other sectors such as maritime shipping, ground transportation and energy generation as there is now a consistent set of estimates.
This story was adapted from a press release issued by Manchester Metropolitan University .
For more information, contact Theo Stein, NOAA Communications, at [email protected] .


Those delicious smells may be impacting air quality

No sign of greenhouse gases increases slowing in 2023

First-of-its-kind experiment illuminates wildfires in unprecedented detail

5 science wins from the 2023 NOAA Science Report
Popup call to action.
A prompt with more information on your call to action.
Big data reveals true climate impact of worldwide air travel
Global aviations emissions reporting requirements under the unfcc treaty don't show the real impact of air travel.
For the first time ever, researchers have harnessed the power of big data to calculate the per-country greenhouse gas emissions from aviation for 197 countries covered by an international treaty on climate change.
When countries signed the 1992 United Nations Framework Convention on Climate Change treaty, high-income countries were required to report their aviation-related emissions. But 151 middle and lower income countries, including China and India, were not required to report these emissions, although they could do so voluntarily.
This matters because the United Nations Framework Convention on Climate Change relies on country reports of emissions during negotiations on country-specific emissions cuts.
"Our work fills the reporting gaps, so that this can inform policy and hopefully improve future negotiations," says Jan Klenner, a PhD candidate at NTNU's Industrial Ecology Programme and the first author of the new article, which was recently published in Environmental Research Letters.
The new data show that countries such as China, for example, which did not report its 2019 aviation-related emissions, was second only to the United States when it came to total aviation-related emissions.
"Now we have a much clearer picture of aviation emissions per country, including previously unreported emissions, which tells you something about how we can go about reducing them," said Helene Muri, a research professor at the Norwegian University of Science and Technology's Industrial Ecology Programme. Muri was one of Klenner's supervisors and a co-author of the paper.
Big surprises -- or not
As might be expected, the United States is at the top of the list of emitters when it comes to the total sum of aviation emissions for both international and domestic flights.
"When we looked at how emissions are distributed per capita, we could see that economic well-being leads to more aviation activity," Klenner said.
That analysis also showed that wealthy Norway, with just 5.5 million people, was third place overall, just behind the US and Australia, when domestic emissions were calculated on a per-capita basis.
Klenner tested the model he developed for this analysis by using data from Norway. He published a paper reporting those results in 2022.
You might think that Norway's geography -- a long, narrow country with lots of mountains and a sparsely populated northern area -- would be the culprit behind the numbers. But Klenner's 2022 analysis showed that fully 50 per cent of Norway's domestic flights were between the country's major cities, Oslo, Trondheim, Stavanger, Bergen and Tromsø.
"The per person emissions in Norway were incredibly high," Muri, who also co-authored that paper, said. "With this data set we can confirm that from a Norwegian perspective we have a lot of work to do, because we are third in the world when it comes to emissions per person from domestic emissions."
A role for big data
Anders Hammer Strømman, a professor at NTNU's Industrial Ecology Programme and Klenner's co-supervisor, said one important aspect of the study is that it shows how big data can be used to help in regulating climate emissions. Strømman was also a co-author of the new paper.
"I think it very nicely illustrates the potential in this type of work, where we have previously relied on statistical offices and reporting loops that can take a year or more to get this kind of information," he said. "This model allows us to do instant emissions modeling -- we can calculate the emissions from global aviation as it happens."
The model, called AviTeam, is the first to provide information for the 45 lesser-developed countries that have never inventoried their greenhouse gas emissions from aviation. Strømman says the model provides these countries with information that might be otherwise difficult or impossible for them to collect.
The abillity to calculate nearly real-time aviation emissions could also provide an important tool as the industry makes changes to de-carbonize.
"In the transition where we're talking about the introduction of new fuels and new technologies, this type of big data allows us to identify those types of corridors or operations where it makes sense to test those strategies first," Strømman said.
- Energy Policy
- Environmental Policy
- Environmental Issues
- Environmental Policies
- World Development
- Surveillance
- United Nations Framework Convention on Climate Change
- Climate change mitigation
- Air pollution
- Polyethylene
- Geologic temperature record
- Automobile emissions control
- Consensus of scientists regarding global warming
- Sulfur hexafluoride
Story Source:
Materials provided by Norwegian University of Science and Technology . Original written by Nancy Bazilchuk. Note: Content may be edited for style and length.
Journal Reference :
- Jan Klenner, Helene Muri, Anders H Strømman. Domestic and international aviation emission inventories for the UNFCCC parties . Environmental Research Letters , 2024; 19 (5): 054019 DOI: 10.1088/1748-9326/ad3a7d
Cite This Page :
Explore More
- Life Expectancy May Increase by 5 Years by 2050
- Toward a Successful Vaccine for HIV
- Highly Efficient Thermoelectric Materials
- Toward Human Brain Gene Therapy
- Whale Families Learn Each Other's Vocal Style
- AI Can Answer Complex Physics Questions
- Otters Use Tools to Survive a Changing World
- Monogamy in Mice: Newly Evolved Type of Cell
- Sustainable Electronics, Doped With Air
- Male Vs Female Brain Structure
Trending Topics
Strange & offbeat.
Advertisement
Environment
It turns out planes are even worse for the climate than we thought.
By Michael Le Page
27 June 2019

Contrails produce a global warming effect
Roman Becker/EyeEm/Getty
The contrails left by aeroplanes last only hours. But they are now so widespread that their warming effect is greater than that of all the carbon dioxide emitted by aeroplanes that has accumulated in the atmosphere since the first flight of the Wright brothers.
Worse still, this non-CO2 warming effect is set to triple by 2050, according to a study by Ulrike Burkhardt and Lisa Bock at the Institute of Atmospheric Physics in Germany.
Altogether, flying is responsible for around 5 per cent of global warming, the team says, so this figure will soar even higher – and no meaningful actions are being taken to prevent this.
“Lots of people talk about the need to stop air traffic increasing all the time, but this is not taken that seriously,” says Burkhardt.
And the discussions that are taking place focus almost entirely on the associated CO2 emissions . “That’s a problem if the non-CO2 effects are larger than the CO2 ones,” she says.
“The non-CO2 warming is the elephant in the room,” says Bill Hemmings of Transport & Environment, a Belgium-based campaign group.
All aircraft that burn fuels leave behind a trail of exhaust fumes and soot. At high altitudes, water vapour often condenses on the soot particles and freezes to form a cirrus cloud that can persist for seconds to hours, depending on temperature and humidity.
Clouds can have both a cooling and warming effect. They reflect some of the sun’s rays back into space, but also block some of the heat radiated by Earth’s surface. On average, both thin natural cirrus clouds and contrails have a net warming effect .
Burkhardt and her colleagues used a computer model of the atmosphere to estimate how much warming contrails caused in 2006 – the latest year for which a detailed air traffic inventory is available – and how much they will cause by 2050, when air traffic is expected to be four times higher.
Read more: Earth could warm by 14°C as growing emissions destroy crucial clouds
The model accounts for not only of the change in air traffic volume, but also the location and altitude of flights, along with the changing climate.
The team concludes that the warming effect of contrails will rise from 50 milliwatts per square metre of Earth’s surface in 2006 to 160 mW/m 2 by 2050.
In comparison, the warming due to CO2 from aviation will rise from 24 to 84 mW/m 2 by this time.
In a scenario in which the airline industry increases fuel efficiency and reduces the number of soot particles emitted by improving fuels and engines, the warming from contrails by 2050 is limited to 140 mW/m 2 and the warming from CO2 to 60 mW/m 2 .
Hard to cut
But reducing contrail warming won’t be easy. “It’s much harder than CO2,” says Burkhardt, and we aren’t doing anything effective about that either.
“There’s absolutely no doubt that aviation CO2 needs to be addressed properly, and there is absolutely no doubt that it is not being addressed at all effectively,” says Hemmings.
An international scheme called Corsia is supposed to limit aviation emissions. But its plan is instead to offset emissions, an approach known to be ineffective . What’s more, the airline industry is trying to use Corsia to block additional measures such as taxes on aviation fuel.
Read more: EU set to resist air industry attempts to limit climate change action
And then there is the non-CO2 warming. “The attitude has been that there are uncertainties, so let’s sit on our hands and do nothing,” says Hemming.
There are indeed large uncertainties whenever clouds are involved , says Burkhardt, but these go both ways. The study could be underestimating contrail warming by as much as 70 per cent.
The one bit of good news is that as contrails become more common, they reduce natural cirrus cloud formation by using up all the water available. This cuts the overall warming effect attributable to contrails by a fifth.
Atmospheric Chemistry and Physics DOI: 10.5194/acp-19-8163-2019
Sign up to our weekly newsletter
Receive a weekly dose of discovery in your inbox! We'll also keep you up to date with New Scientist events and special offers.
More from New Scientist
Explore the latest news, articles and features
Turbulence on flights is getting worse because of climate change
Will we ever see commercial plane flights without human pilots.
Subscriber-only
Long-haul flights: bad for the planet, necessary for global research
Popular articles.
Trending New Scientist articles
Climate Matters • December 6, 2023
Climate Change is Disrupting Air Travel

Click to download custom graphics
KEY CONCEPTS
Burning fossil fuels for aviation contributes to global warming — and the resulting warming is disrupting air travel.
Flooding caused by rising seas and storm surges threatens access and operations at coastal airports.
More extreme weather events, warmer air temperatures, and shifts in the jet stream can also disrupt air travel and increase in-flight safety risks.
Last year, 917 million passengers took over 15 million U.S.-based flights — an average of more than 42,000 flights per day.
Fossil fuels burned for global air travel and airport operations contribute to the carbon pollution that is warming the planet. In 2022, global air travel emitted more than 780 Mt CO2 , accounting for about 2% of global energy-related CO2 emissions that year. Emissions from aviation have steadily increased, quadrupling from 1966 to 2018.
Air travel not only contributes to heat-trapping pollution — the resulting warming now poses new and growing challenges for air travel.
Weather currently causes more than 75% of air traffic delays in the U.S. As climate change worsens coastal flooding and extreme weather events, more flights could be grounded from weather-related delays. A warming atmosphere can also increase in-flight turbulence.
Five ways climate change is disrupting air travel
1. Coastal airports are at risk from rising seas and storm surges.
Rising seas due to human-caused warming are worsening coastal floods during both regular high tides and coastal storms; and storm surge is affecting larger areas in many U.S. cities because of rising seas.
Runways at some major airports in U.S. cities and abroad are at risk of closures, delays, and damage due to coastal flooding, particularly after major storms . Access for passengers and employees can also be impacted if access roads are inundated.
2. Heat can affect plane capacity and restrict takeoff.
Warm air is less dense than cool air. Hotter temperatures at ground level therefore make it more difficult for airplanes to gain enough lift to take flight.
Hotter temperatures can cause weight restrictions for flight take-off — meaning fewer passengers and reduced capacity for luggage, cargo, and fuel. In some cases, planes may require longer runway distances to generate enough lift.
3. Climate change is increasing the risk of lightning strikes in flight.
The potential for severe storms is increasing in some parts of the U.S., particularly in the eastern half of the country. One study projects that annual lightning strikes in the U.S. could increase by 12% for every 1°C (1.8°F) of global warming.
Lightning strikes can damage electrical systems and equipment on large commercial aircraft. The average passenger plane is struck by lightning one or two times per year . Following lightning strikes, planes are subject to inspection and repairs, which can take them out of service and cause delays.
4. A shifting jet stream could mean a longer round trip journey.
In recent decades, scientists have observed changes in the jet stream — narrow bands of strong wind high in the atmosphere that move west to east along the boundaries between hot and cold air. The influence of global warming on these observed changes is not yet fully understood.
Research suggests that changing wind patterns could impact travel times in the Northern Hemisphere — potentially making west-bound flights longer, while speeding up east-bound flights. These changes could affect route planning, scheduling, and fuel consumption.
5. Increased wind shear in the jet stream is causing more hazardous turbulence.
One observed change to the jet stream includes stronger wind shear at flight cruising altitudes, which can increase turbulence during flights.
A certain type of turbulence known as clear-air turbulence can’t be seen by pilots or detected by radar. Clear-air turbulence is more likely to occur during winter months.
A recent study found a 41% increase in severe clear-air turbulence over the U.S. between 1979 and 2020 — and it is projected to increase further due to climate change.
The future of flying
Reducing heat-trapping pollution from air travel now is critical to limit future warming. But some consequences from rising temperatures are unavoidable, even with rapid cuts to carbon pollution. The aviation industry is faced with a need to adapt air travel for a warming world to protect passengers and employees, as well as keep costs under control.
Adaptation measures, including seawalls or other coastal defenses , can help protect existing airports from rising seas and storm surges, but they can be costly and complicated. The Shoreline Protection Program at San Francisco Airport is one example of how U.S. airports might build climate resilience.
In especially hot locations or during summer, airports may choose to schedule flights during cooler parts of the day to mitigate heat effects. Where possible, airports may expand runways to accommodate longer takeoff distances.
LOCAL STORY ANGLES
Find out if your local airport is vulnerable to coastal flooding..
Read Climate Central’s assessment of 23 major U.S. cities that are vulnerable to coastal flooding during this decade. Or use Climate Central’s Coastal Risk Screening Tool to map localized vulnerability to sea level rise and storm surges around your city’s airport.
See which airports are experiencing delays.
Extreme weather events, heat, or flooding can ground planes and disrupt domestic and international air travel with cascading impacts. The Federal Aviation Administration provides status updates on delays at airports across the U.S. (but specific flight information and delay causes aren’t reported here.)
CONTACT EXPERTS
Paul D. Williams, PhD Professor of Atmospheric Science. University of Reading Relevant expertise: atmospheric turbulence, jet streams, climate change, and aviation Contact: [email protected] * Available for interviews on or after December 11, 2023
FIND EXPERTS
Submit a request to SciLine from the American Association for the Advancement of Science or to the Climate Data Concierge from Columbia University. These free services rapidly connect journalists to relevant scientific experts.
Browse maps of climate experts and services at regional NOAA, USDA, and Department of the Interior offices.
Explore databases such as 500 Women Scientists , BIPOC Climate and Energy Justice PhDs , and Diverse Sources to find and amplify diverse expert voices.
Reach out to your State Climate Office or the nearest Land-Grant University to connect with scientists, educators, and extension staff in your local area.
Filed under:
Air travel is a huge contributor to climate change. A new global movement wants you to be ashamed to fly.
Greta Thunberg gave up flights to fight climate change. Should you?
Share this story
- Share this on Facebook
- Share this on Twitter
- Share this on Reddit
- Share All sharing options
Share All sharing options for: Air travel is a huge contributor to climate change. A new global movement wants you to be ashamed to fly.
It was 2007, during a trip to visit her sister in Norway’s pristine Lofoten Islands , when Maja Rosén had an unsettling thought.
As she took in the breathtaking archipelago north of the Arctic Circle that is dotted with mountains, carved with fjords, and circled by sea eagles, she remembered she was looking at one of the fastest-warming regions of the planet.
And she realized that how she got there was part of the problem.
She’d carpooled with friends to Oslo from her home in Gothenburg, Sweden. The final leg was a short boat ride to the islands. And in between was a 500-mile flight from Oslo to Bodø.
:no_upscale()/cdn.vox-cdn.com/uploads/chorus_asset/file/18334968/GettyImages_588645430_t.jpg)
For the distance, short flights produce a larger amount of greenhouse gas emissions per passenger compared to longer routes. That fact wasn’t something that struck her on her previous jaunts, like her flights to the United Kingdom to visit friends.
But upon basking in the fragile and sublime wonders of Lofoten, Rosén began to consider how her own actions might be threatening the region. The contradiction between her admiration for the scenery and her pollution from getting there, she decided, was too much to bear.
“It felt so wrong that my flight there was contributing to destroying that place,” Rosén, now 38, said. Soon after, she drastically curbed her flying, but in 2008, she concluded it wasn’t enough. “That’s when I decided not to fly again, and I have not regretted that decision,” she said.
Rosén has only become more alarmed and more determined to reduce emissions from air travel since then. Last year, she gave up her spot in medical school to focus on convincing other people to join her.
She founded a group called We Stay on the Ground in 2018 to recruit people to pledge to give up flying for one year. But the pledge only kicks in once 100,000 people in a given country have committed to doing the same. The threshold is a way to show participants that they’re not alone.
“For most people, it’s to know that others have made this decision. That’s really the most powerful way to make people change their minds,” Rosén said. So far, more than 8,000 people around the world have made the pledge.
Her effort may now be getting a boost from another Swede, 16-year-old climate change activist Greta Thunberg . She gained recognition when she went on strike from school last year to protest her government’s inaction on climate change, sparking a series of worldwide demonstrations, most recently the September 20 strike that drew an estimated 4 million people around the world.
But even after becoming a global celebrity, Thunberg has led by example, traveling to events around Europe mainly by train . She’s currently sailing from the US to Portugal to attend the UN climate meeting in Madrid in December.
Some Swedish airports have now reported a decline in travelers , which some activists attribute to the “ Greta effect ,” a newfound awareness of humanity’s impacts on the planet and a desire to make a difference.
:no_upscale()/cdn.vox-cdn.com/uploads/chorus_asset/file/18334956/GettyImages_1138051649_t.jpg)
The Swedes have even coined a word for the shame that travelers are beginning to feel about flying: flygskam , pronounced “fleeg-skahm.”
Rosén is trying to use flygskam to her advantage. She resolved last year to swallow her squeamishness about making her friends reckon with their own travel “because I sort of got fed up with being more scared of being socially inconvenient than climate collapse,” she said.
It’s not just Sweden; environmental activists, scientists who study the climate, and ordinary people in other countries like Switzerland , the United Kingdom , Germany , and the United States are curbing their air travel, if not giving it up outright.
However, the growing global alarm about the environmental impacts of aviation comes as air travel continues to rise. A record 31.6 million passengers are expected travel on US airlines this week for the Thanksgiving holiday, CNN reported . Our global economy is tightly interwoven with aviation as it carries goods and facilitates commerce. Leisure flights are also increasing, and growing demand for services like two-day and overnight shipping has led some companies like Amazon to invest more in cargo aircraft.
All this demand is expected to soar higher, particularly as prices for flights decline and wealth grows in emerging economies.
For regular flyers, air travel is often the dominant contributor to their greenhouse gas footprints. With the window rapidly closing to limit global warming to a bearable level — scientists warn that the planet has as little as 12 years to halve global emissions to restrict warming to 1.5 degrees this century — it is more critical than ever to find a way to shrink aviation’s carbon footprint. Every bit of carbon dioxide we emit now will linger in the atmosphere and warm the planet for decades, but completely decarbonizing aircraft will likely require technologies that are decades away. Reducing the number of flights is one of the few surefire ways to curb emissions in the meantime.
But unlike many other activities that contribute to climate change, air travel serves a valuable social function. It gives remote towns a lifeline to critical fuels, food, and medicines. It helps families stay connected across continents. It opens the door to life-changing experiences.
So reducing air travel demands a difficult moral reckoning, even if we make the decision solely for ourselves. But activists like Rosén say these actions have consequences for the whole world, so we cannot afford to make them without forethought.
Flying’s growing effect on the environment
If you’re a regular flyer, odds are that your biggest single source of greenhouse gas emissions each year is air travel. It likely dwarfs the footprint of all the lights in your home, your commute to work, your hobbies, and maybe even your diet.
“Euro for euro, hour for hour, flying is the quickest and cheapest way to warm the planet,” said Andrew Murphy, aviation manager at Transport & Environment, a think tank in Brussels.
:no_upscale()/cdn.vox-cdn.com/uploads/chorus_asset/file/18334947/GettyImages_543857900_t.jpg)
That’s alarming because humanity can only emit so much more carbon dioxide to limit warming this century to 1.5 degrees Celsius, the more ambitious goal under the 2015 Paris climate agreement. An international team of researchers last year reported that meeting this target would require halving global emissions by as soon as 2030 , reaching net-zero emissions by 2050, and even getting to negative emissions thereafter.
Right now, the world is flying in the opposite direction. Global emissions reached a record high last year, and so did atmospheric concentrations of carbon dioxide .
Air travel is a big reason why. A one-way flight across the Atlantic from New York City to London emits one ton of carbon dioxide per passenger. There are upward of 2,500 flights over the North Atlantic every day.
And that’s just one air corridor. Around the world, aviation emits about 860 million metric tons of carbon dioxide every year, or about 2 percent of total global greenhouse gas emissions. Those numbers are poised to soar. The International Civil Aviation Organization projects that emissions from air travel will grow between 300 and 700 percent by 2050 compared to 2005 levels.
Those emissions in turn stand to have a devastating impact. The planet has already warmed by 1 degree Celsius since the dawn of the Industrial Revolution, which has caused rising seas and more frequent and intense heat waves. Every metric ton of carbon dioxide emitted leads to 3 square meters of Arctic sea ice loss . Aircraft also emit several other pollutants at altitude, like particulates, sulfur compounds, and nitrogen compounds, which have an additional warming effect. In some parts of the Arctic under busy air routes, these pollutants combined contribute one-fifth of the warming .
So the environmental costs of air travel are huge and growing, and the worst impacts will befall future generations. At the same time, there are very few options to limit those emissions except to not fly.
But that’s if you fly to begin with. In the United States, fewer than half of travelers in 2017 took a trip by air, according to an industry survey . Globally, less than one-fifth of the population has ever buckled in for a flight. That means a minority of frequent flyers contribute a disproportionate share of emissions. So reducing air travel is one of the most effective things individuals can do to shrink their carbon footprints.
Why flying is such a challenge for the environment
The fundamental problem behind decarbonizing air travel is the physics. To fly, you need an energy source that crams a lot of power into a small space, and right now, there is nothing as energy-dense as jet fuel , which has a specific energy of 11,890 watt-hours per kilogram.
Batteries aren’t even in the same airport. The best lithium-ion batteries top out at 265 watt-hours per kilogram , which is nowhere near enough get an airliner across the Pacific. The technology is improving, but one estimate shows that electrification of airliners will only start to make a dent in air travel emissions by midcentury.
At the same time, there is very little room left for making air travel more efficient. The current generation of jet engines is already closing in on its maximum efficiency. Fuel is also often the largest single expense for airlines, so they already face intense pressure to go farther with less.
One strategy to deal with aircraft emissions is to purchase credits or offsets. Many websites will calculate the emissions of your flight and sell you means to offset them, whether through planting trees that take up a given quantity of carbon dioxide or financing renewable energy projects to displace fossil fuels. But these offsetting programs are only as good as the accounting behind them, and for some, their effectiveness so far in limiting greenhouse gas emissions is questionable .
“The research shows that three-quarters of the offsets don’t deliver the reductions they claim to deliver,” said Anja Kollmuss, a policy analyst in Zurich who studies emissions trading.
Another option is to use a carbon-neutral fuel. Airlines are experimenting with biofuels derived from plants. Since plants recycle carbon that’s already in the atmosphere rather than introducing new carbon into the air, in theory, fuels derived from these crops have no net effect on the climate. In practice, it can be tricky to manage the energy balance of growing biofuels such that you aren’t expending more energy than you get out of them. Fuel crops also require land, and it’s not clear where all the land needed to sustain a wholesale shift of the global aviation industry will come from. Right now, biofuels are also expensive.
Yet another possibility is electrofuels . That’s where you use electricity to power a mechanism that stitches carbon dioxide from the air into longer molecules that can serve as fuels. However, it requires gobs of zero-emissions energy, and the technology is still in a gestational phase.
While there may be technology solutions for cutting the emissions for aviation in the future, there are few options available today beyond simply flying less. “We see this as individuals taking this into their own hands after governments have failed to act,” Murphy said.
Shorter flights have a disproportionately large carbon footprint
It takes a lot of energy to get a fully loaded airliner 6 miles into the air. On short flights, upward of 25 percent of the fuel used is consumed during takeoff.
Once at cruising altitude, though, the aircraft becomes much more fuel-efficient. That means longer, direct journeys have a smaller carbon footprint than shorter connecting hops. But only to a point.
For extremely long hauls, the extra fuel needed for the journey adds enough weight that the flight’s fuel efficiency is reduced, thereby increasing its carbon footprint per mile.
Depending on the aircraft and the route, there is an optimal distance for an air route that minimizes carbon dioxide emissions per passenger per mile — it follows a bathtub curve. One estimate from the Worldwatch Institute pegged the most fuel-efficient flight length at 2,600 miles, a bit longer than the distance between New York and Los Angeles.
:no_upscale()/cdn.vox-cdn.com/uploads/chorus_asset/file/18334678/FLYING_SHAME_CHART_edited.jpg "impact of air travel on global warming")
But short-haul flights are increasing as countries like China, India, and Brazil open new routes to accommodate a voracious demand for domestic air travel.
Flying first-class also carries a larger carbon footprint, upward of three times larger than passengers in coach — partly because first-class seats are heavier and take up more floor space than cheaper sections of the aircraft.
A worldwide movement is growing. Sweden is its current epicenter.
Sweden is a somewhat odd place to emerge as the leader in flying shame and staying on the ground: It’s not the country with the most air travel or the highest per capita emissions . But in recent years, Swedish celebrities started pushing the idea into the mainstream. In 2015, Swedish Olympic biathlon gold medalist Björn Ferry committed to stop flying. Then in the fall of 2017, 10 Swedish celebrities published an article about deciding to no longer fly.
In 2018, the Swedish government began debating a tax on flying, and more national celebrities began to weigh in against air travel; the renowned Swedish writer Jens Liljestrand published a well-read article with the memorable title “I’m fed up with showing my child a dying world.”
The potential impacts of climate change also became startlingly vivid to many Swedes last year as an oppressive heat wave baked the country and dried out its forests. That heat helped fuel wildfires, with several igniting north of the Arctic Circle .
“It’s the first time Swedish people felt the consequences of climate change themselves,” Rosén said. “[L]ast summer was so dry and things were just looking yellow, and we were lacking water.”
Then in August 2018, Thunberg began her strike outside the Swedish parliament building, an action that soon launched her message worldwide.
Birgitta Frejhagen, 76, was so inspired by Thunberg that she founded a group called “Gretas Gamlingar” (Greta’s oldies). Her goal is to encourage older people to get involved in climate activism. She is currently aiming to recruit 10,000 Swedish seniors to participate in the World Action Day for the Climate on September 27 to coincide with a global youth climate strike .
Frejhagen noted that despite the alarm about the climate, flying is hard for Swedes like her to avoid. Many have family spread out over the large, sparsely populated country. Frejhagen broke her hip earlier this year, so long train or bus journeys are a painful ordeal.
“There is a shame of flying, but sometimes you have to fly,” she said.
Rosén said there isn’t anything unique in the Swedish soul that has made so many across the country so concerned about flying. “This could have happened anywhere,” she said. “We’ve had some good coincidences that have worked together to create this discussion.”
Nonetheless, the movement to reduce flying has created a subculture in Sweden, complete with its own hashtags on social media. Beyond flygskam, there’s flygfritt (flight free), and vi stannar på marken (we stay on the ground).
Rosén said that judging by all the organizing she’s seen in other countries, she thinks Sweden won’t long hold the lead in forgoing flying. “I wouldn’t be surprised if the Germans would follow us soon,” she said.
Scientists are having a hard time overlooking their own air travel emissions
Kim Cobb, a climate scientist at the Georgia Institute of Technology, has curbed her air travel by 75 percent.
“I really started thinking about my carbon footprint after Trump was elected,” she said. “Doing my climate science and donating to the right candidates was never going to be enough, even if you took that to scale.”
She created a spreadsheet to track her personal carbon footprint and found that flying formed the dominant share of her emissions. “By the end of 2017, 85 percent of my carbon footprint was related to flying,” she said.
Much of Cobb’s research — examining geochemical signals in coral to reconstruct historical climate variability — required her to travel to field sites in the equatorial Pacific.
While she doesn’t anticipate giving up those visits entirely, Cobb has taken on more research projects closer to home, including an experiment tracking sea level rise in Georgia. She has drastically reduced her attendance at academic conferences and this year plans to give a keynote address remotely for an event in Sydney.
I have begun replying to invitations “Due to the climate emergency, I am cutting down on air travel ...” Have been pleasantly surprised how many take up my offer of pre-recorded talk & Skype Q&A’s @GreenUCL @UCLPALS @UCLBehaveChange https://t.co/Hlxc4R6Lj3 — Susan Michie (@SusanMichie) June 29, 2019
Cobb is just one of a growing number of academics , particularly those who study the earth, who have made efforts in recent years to cut their air travel.
While she doesn’t anticipate making a dent in the 2.6 million pounds per second of greenhouse gases that all of humanity emits, Cobb said her goal is to send a signal to airlines and policymakers that there is a demand for cleaner aviation.
But she noted that her family is spread out across the country and that her husband’s family lives in Italy. She wants her children to stay close to her relatives, and that’s harder to do without visiting them. “The personal calculus is much, much harder,” she said.
She also acknowledged that it might be harder for other researchers to follow in her footsteps, particularly those just starting out. As a world-renowned climate scientist with tenure at her university, Cobb said she has the clout to turn down conference invitations or request video conferences. Younger scientists still building their careers may need in-person meetings and events to make a name for themselves. So she sees it as her responsibility to be careful with her air travel. “People like me have to be even more choosy,” she said.
Activists and diplomats who work on international climate issues are also struggling to reconcile their travel habits with their worries about warming. There is even a crowdfunding campaign for activists in Europe to sail to the United Nations climate conference in Chile later this year.
But perhaps the most difficult aspect of limiting air travel is the issue of justice. A minority of individuals, companies, and countries have contributed to the bulk of greenhouse gas emissions from flights and profited handsomely from it. Is it now fair to ask a new generation of travelers to fly less too?
Airlines and climate-concerned travelers
At least one airline is beginning to acknowledge the concern around flying. KLM CEO Pieter Elbers wrote in a letter in June that “we invite all air travellers to make responsible decisions about flying.” The letter showed no sign of the airline itself changing its ways, but the fact that KLM was even hinting at shaming its own passengers shows that climate concerns are difficult to ignore.
Cultural changes could become a big part of reshaping demand for air travel. Shifting tastes away from impressing friends with distant, Instagram-perfect destinations and more staycations could eventually yield some reductions in greenhouse gases from aircraft.
Transport & Environment’s Murphy also noted that for a long time, aviation fuels in many countries weren’t taxed, nor were their greenhouse gas emissions, so the aviation sector hasn’t faced the same pressure to decarbonize as the automotive industry. In fact, many countries directly and indirectly subsidize air travel, whether through tax breaks for aircraft manufacturers or government ownership of airlines. While this is slowly changing — France is set to introduce a new tax on airlines, for example — much more drastic policy action is needed to curb emissions from air travel.
However, targeting the consumers of goods and services rather than just their producers is a much more fraught political debate. It’s a more direct way of changing behavior and it shifts some of the costs directly to buyers, making the costs of curbing emissions much more visible, and contentious. Cutting consumption also brings up concerns about justice. Many activists argue that the heaviest burden of fighting climate change should be borne by large institutions rather than individuals. So while some airlines would prefer to embarrass their customers, climate campaigners say it’s the airlines themselves that should feel most ashamed.
Should you, dear traveler, feel ashamed to fly?
“Travel is fatal to prejudice, bigotry and narrow-mindedness, and many of our people need it sorely on these accounts,” wrote Mark Twain in The Innocents Abroad . “Broad, wholesome, charitable views of men and things can not be acquired by vegetating in one little corner of the earth all one’s lifetime.”
Air travel has yielded immense benefits to humanity. Movement is the story of human civilization, and as mobility has increased, so too has prosperity . Airplanes, the fastest way to cross continents and oceans, have facilitated this. And while some countries have recently retreated from the world stage amid nationalist fervor , the ease of air travel has created a strong countercurrent of travelers looking to learn from other cultures.
Compared to other personal concessions for the sake of the environment, reducing air travel has a disproportionately high social cost. Give up meat and you eat from a different menu. Give up flying and you may never see some members of your family again.
So it’s hard to make a categorical judgment about who should fly and under what circumstances.
But if you’re weighing a plane ticket for yourself, Paul Thompson, a professor of philosophy who studies environmental ethics at Michigan State University, said there are several factors to consider.
No need to tell me about your feelings of guilt. I see no reason for you to feel guilty. You already excel at ethical thinking in many other areas of your life and relationships. Judge for yourself what the times require of you, personally and politically. Act or don't act. — flyingless (@flyingless) July 17, 2019
First, think about where you can have the most meaningful impact on climate change as an individual — and it might not be changing how you are personally getting around. If advocacy is your thing, you could push for more research and development in cleaner aviation, building high-speed rail systems, or pricing the greenhouse gas emissions of dirty fuels. “That’s the first thing that I think I would be focused on, as opposed to things that would necessarily discourage air travel,” Thompson said. Voting for leaders who make fighting climate change a priority would also help.
If you end up on a booking site, think about why you’re flying and if your flight could be replaced with a video call.
Next, consider what method of travel has the smallest impact on the world, within your budget and time constraints. If you are hoping to come up with a numerical threshold, be aware that the math can get tricky. Online carbon footprint calculators can help.
And if you do choose to fly and feel shame about it, well, it can be a good thing. “I think it’s actually appropriate to have some sense of either grieving or at least concern about the loss you experience that way,” Thompson said. Thinking carefully about the trade-offs you’re making can push you toward many actions that are more beneficial for the climate, whether that’s flying less, offsetting emissions, or advocating for more aggressive climate policies.
Nonetheless, shame is not a great feeling, and it’s hard to convince people they need more of it. But Rosén says forgoing flying is a point of pride, and she’s optimistic that the movement to stay grounded will continue to take off.
Will you support Vox today?
We believe that everyone deserves to understand the world that they live in. That kind of knowledge helps create better citizens, neighbors, friends, parents, and stewards of this planet. Producing deeply researched, explanatory journalism takes resources. You can support this mission by making a financial gift to Vox today. Will you join us?
We accept credit card, Apple Pay, and Google Pay. You can also contribute via
Social media platforms aren’t equipped to handle the negative effects of their algorithms abroad. Neither is the law.
The real science behind the billionaire pursuit of immortality, if you want to belong, find a third place, sign up for the newsletter today, explained, thanks for signing up.
Check your inbox for a welcome email.
Oops. Something went wrong. Please enter a valid email and try again.
- Share full article
Advertisement
Supported by
A Big Climate Problem With Few Easy Solutions: Planes
The airline industry might not be able to reduce greenhouse gas emissions for decades because most solutions are not yet viable.

By Niraj Chokshi and Clifford Krauss
The worst of the pandemic may be over for airlines, but the industry faces another looming crisis: an accounting over its contribution to climate change.
The industry is under increasing pressure to do something to reduce and eventually eliminate emissions from travel , but it won’t be easy. Some solutions, like hydrogen fuel cells, are promising, but it’s unclear when they will be available, if ever. That leaves companies with few options: They can make tweaks to squeeze out efficiencies, wait for technology to improve or invest today to help make viable options for the future.
“It’s a big crisis, it’s a pressing crisis — a lot needs to be done soon,” said Jagoda Egeland, an aviation policy expert at the International Transport Forum, a unit of the Organization for Economic Cooperation and Development. “It’s a hard-to-abate sector. It will always emit some carbon.”
Experts say commercial air travel accounts for about 3 to 4 percent of total U.S. greenhouse gas emissions. And while planes become more efficient with each new model, growing demand for flights is outpacing those advancements. The United Nations expects airplane emissions of carbon dioxide, a major greenhouse gas, to triple by 2050 . Researchers at the International Council on Clean Transportation say emissions may grow even faster .
Before the pandemic, a “flying shame” movement , which aims to discourage air travel in favor of greener options like rail, was gaining ground globally thanks to Greta Thunberg, a Swedish climate activist. There were early signs that it may have reduced air travel in Germany and Sweden . Now French lawmakers are considering a ban on short flights that can be replaced by train travel .
Investors are pushing businesses to disclose more about their efforts to lobby lawmakers on climate issues, too. And some large corporations, whose employees crisscross the globe and fill plush business class seats, are reviewing travel budgets to reduce expenses and emissions.
The urgency isn’t lost on the industry. Scott Kirby, the chief executive of United Airlines, speaks often about the need to address climate change, but even he acknowledges that it will be difficult for the industry to clean up its act. He wants United and other airlines to try different things and see what works.
“It is the biggest long-term issue that our generation faces. It is the biggest risk to the globe,” Mr. Kirby said in a recent interview. “There are plenty of things we can compete on, but we all ought to be trying to make a difference on climate change.”
There are efforts to electrify small planes for short flights — including one backed by United — but doing the same for longer, larger flights will be tough, maybe impossible. Commercial planes like the Boeing 787 and Airbus A320, which can carry a few hundred passengers, require an immense amount of energy to reach cruising altitude — more energy than modern batteries can efficiently supply.
Someday, hydrogen fuel cells and synthetic jet fuel could help to decarbonize the industry, and pilot projects have already begun, mainly in Europe, where Airbus says it plans to build a zero-emission aircraft by 2035 . Boeing has put its emphasis on developing more fuel-efficient planes and is committed to ensuring that all of its commercial planes can fly exclusively on “sustainable” jet fuel made from waste, plants and other organic matter.
‘It’s going to be a real stretch.’
At a petrochemical plant outside Houston, Neste U.S. and Texmark Chemicals are converting imported undistilled diesel into renewable jet fuels. The undistilled diesel is made from used cooking oil and waste from vegetable and animal processing plants.
Neste, a Finnish company, is the world’s largest producer of renewable jet fuel. Its U.S. customers include American Airlines, JetBlue and Delta Air Lines.
United, which buys renewable jet fuel from Fulcrum BioEnergy and World Energy, recently announced a deal with more than a dozen major corporate customers, including Deloitte, HP and Nike, that will result in the airline’s buying about 3.4 million gallons of sustainable fuel this year. American has an agreement to buy nine million gallons of such fuel over several years, and Delta says it plans to replace a tenth of its jet fuel with sustainable alternatives by 2030.
“There is huge growth potential for sustainable aviation fuel,” said Jeremy Baines, president of Neste U.S. “It’s a niche market today, but it’s growing very rapidly. Between today and 2023 we are going to increase our production at least 15-fold.”
Neste produces 35 million gallons of renewable aviation fuel and hopes to reach 515 million gallons annually by the end of 2023 by ramping up production at refineries in Singapore and Rotterdam, the Netherlands. That is enough to fuel close to 40,000 flights by wide-body aircraft between New York and London, or well over a year’s worth of prepandemic air travel between the two cities.
But it is important to put those numbers in perspective. U.S. airlines used more than 18 billion gallons of fuel in 2019 , and the country as a whole consumes more than 100 billion gallons of petroleum products annually.
Rystad Energy, a Norwegian consulting firm, predicts that renewable fuels will become increasingly economical after 2030 and supply 30 percent of all aviation fuel by 2050. But IHS Markit, a U.S. consulting firm, estimates that sustainable jet fuel will make up only 15 percent of all jet fuel by 2050.
Renewable jet fuel has its limits, too. The fuel reduces carbon emissions by only 30 percent to 50 percent compared with conventional jet fuel, according to Daniel Evans, the global head of refining and marketing at IHS Markit. What’s more, production of the fuel can cause deforestation when the raw materials are farmed.
Some companies want to get around those problems by avoiding agricultural crops. Fulcrum, in which United is invested, is planning to build a plant in Britain to produce jet fuel out of waste from landfills and other trash. Red Rock Biofuels, a Colorado company, hopes to use waste woody biomass.
But development of renewable fuels from waste or substances like fast-growing algae and switch grass has been frustratingly slow.
“It’s going to be a real stretch,” Mr. Evans said. “Even if you are burning 100 percent biofuel, it’s still not going to be getting you to carbon neutral.”
Biofuels are also about 50 percent more expensive to make than conventional fuel, according to Michael E. Webber, chief science and technology officer of Engie, a French utility working on advanced jet fuels.
Hydrogen offers another possibility, although probably not for several decades. Instead of batteries or fuel engines, the potential hydrogen-powered aircraft of the future would operate with hydrogen tanks and fuel cells, though the technology would need to be advanced to reduce the size of the tanks and cells. The hydrogen could be made with renewable power sources like the wind and sun to reduce planet-warming emissions. But such fuels cost two to three times more than conventional fuel, experts say.
Several European countries also require refiners to produce and blend renewable jet fuel. The European Union is financially supporting Airbus’s development of a hydrogen-fueled aircraft, and the French government is encouraging Air France to research a synthetic jet fuel.
In the United States, federal support is minimal, so far. Renewable jet fuel producers receive a $1 per gallon subsidy under existing federal tax credits for biodiesel, but a bill introduced this month in the House would provide a tax credit starting at $1.50 per gallon. A tax on carbon emissions could help make alternative fuels more competitive against conventional jet fuel in the future.
Should airlines offset or store carbon?
Another option that many airlines have turned to is carbon offsets . By buying an offset, a company or individual effectively pays somebody else to plant or not cut trees or to take other steps to reduce greenhouse gases.
But the benefits of some offsets are difficult to measure — it’s hard to know, for example, whether landowners would have cut down trees had they not been paid to preserve woods, a common type of offset. Mr. Kirby, the United chief executive, is skeptical that such offsets are effective.
“Traditional carbon offsets are a marketing initiative; they’re greenwashing,” he said. “Even in the few cases where they are real and are making a difference, they’re just so small that they can’t scale to solve the global problem.”
United helps passengers and corporate customers buy offsets, but Mr. Kirby said the company was focusing more on sustainable fuel and removing and storing carbon in perpetuity.
In December, the airline said it was investing in 1PointFive, a joint venture between Occidental Petroleum and a private equity firm that plans to build plants that suck carbon dioxide from the air and store the gas deep underground. This approach would theoretically allow United and other airlines to remove as much carbon from the atmosphere as their planes put into it.
“It’s the only solution I know of that can help get us as a globe to zero, because the others, if you understand the math, they just don’t work,” Mr. Kirby said.
Such efforts had long been dismissed as impractical, but corporations are increasingly pouring money into them as investors and activists pressure businesses to decarbonize. Mr. Kirby said such investments would help to drive down costs. But some experts warn that while direct air capture can help industries that are difficult to decarbonize, the ultimate aim should be to attack the problem at the source.
“If you can avoid the emissions in the first place, it’s so much cheaper and easier than having to pull it back out,” said Jennifer Wilcox, an Energy Department official and expert on direct air capture.
Despite the formidable challenges, Mr. Kirby is optimistic that investments in alternative fuels and carbon capture technology will yield a breakthrough.
“In the near term, it’s about getting them to work economically,” he said. “Once you cross that threshold, you will have an exponential increase.”
Niraj Chokshi covers the business of transportation, with a focus on autonomous vehicles, airlines and logistics. More about Niraj Chokshi
Clifford Krauss is a national energy business correspondent based in Houston. He joined The Times in 1990 and has been the bureau chief in Buenos Aires and Toronto. He is the author of “Inside Central America: Its People, Politics, and History.” More about Clifford Krauss
Explore Our Business Coverage
Dive deeper into the people, issues and trends shaping the world of business..
Elon Musk’s Diplomacy: The billionaire is wooing right-wing world leaders to push his own politics and expand his business empire.
Staying Connected: Some couples are using professional project-management software like Slack and Trello to maintain their relationships. Why does it bother other people ?
A Final Curtain Call: The animatronic band at Chuck E. Cheese, by turns endearing and creepy, will be phased out by year’s end at all but two locations. We visited one of them .
The ‘Betches’ Got Rich: Betches Media, the women’s media company that started as a raunchy college blog, is a rare financial success story. So what’s next ?
Retraining German Workers: As Germany’s industrial landscape shifts, companies have formed an alliance aimed at offering the skills and certification that employees need to find new jobs .

Yearning to fly
We all know the benefits of travel — but a substantial increase in flying seems unsustainable at a time when aviation’s share of emissions is set to rise and most of the world has pledged to keep global warming at 1.5 C.

From “PPE” to “flattening the curve,” the COVID-19 era has added a host of new phrases to our popular lexicon.
One of the most perplexing has to be “revenge travel,” which speaks to the zealous need many of us have to experience sunnier climes after a year or two in a pandemic holding pattern.
No one is quite sure who minted the expression; some people in the tourism business find it a bit distasteful . But it was on full display this past summer, as the mortal risk of COVID-19 subsided and travel returned in force. Airports around the world — including, infamously , Toronto’s Pearson — buckled under the strain.
While the episode produced endless accounts of flight delays and estranged luggage , it showed that, pandemic or no pandemic, we have an unrelenting desire to travel. Just look at the backlog of passport applications, which became a minor scandal for the Canadian government.
One surprising effect of the lockdowns in the early days of the pandemic was a marked drop in carbon emissions, including from aviation. This, combined with a new reliance on video-conferencing, led to “a realization among many of us that there are alternatives to travelling long distances by air to do business,” said Daniel Bresette, executive director at the Environmental and Energy Study Institute (EESI) in Washington, D.C.
But that hasn’t dimmed the desire to fly for fun.
“There is a segment of the population that really feels that COVID set them back in their aspirations for visiting places or catching up on holidays and seeing family,” said Adeniyi Asiyanbi, an assistant professor of geography at the University of British Columbia Okanagan who studies forest-based climate action. “And the last thing they want to think about is precisely emissions.”
Many observers say the current growth trajectory is unrealistic — and that the aviation industry isn’t being frank about it.
The subtext of revenge travel is that getting on a plane to see the world is our right. And the tourism industry, battered by a couple of years of severe turbulence, is happy to accommodate.
To give a sense of just how much we fly, there were nearly 39 million flights worldwide in 2019 ; that was up from 25.9 million in 2009.
The Environmental and Energy Study Institute estimates that global air travel traffic is at about two-thirds of pre-pandemic levels, but projects that North America will return to pre-pandemic levels this year or next, with international markets likely to catch up a couple of years later. Thereafter, EESI expects air passenger traffic to grow by about three to four per cent per year.
We all know the benefits of travel — it allows us to marvel at Earth’s riveting beauty and gain a finer understanding of other cultures. But a substantial increase in flying seems unsustainable at a time when aviation’s share of emissions is set to rise and most of the world has pledged to keep global warming at 1.5 C below pre-industrial temperatures.
This summer alone, we’ve seen drought and forest fires in Europe and devastating flooding in Pakistan, which climate scientists see as linked to climate change — and that’s at (about) 1.2 C of warming.
Many observers, including some who have worked in aviation, like former pilot Todd Smith, say the current growth trajectory is unrealistic — and that the industry isn’t being frank about it.
Said Smith, “There’s a hesitancy to be honest and objective about this.”
Taking to the skies
Seeing the scenes of anguish at airports in recent months, one could forget that air travel used to carry a certain romance.
Commercial flight dates back to about 1919, but it didn’t really become popular until the 1940s.
“After the Second World War, you’re really into the age of mass tourism,” said Emily Thomas, author of The Meaning of Travel: Philosophers Abroad .
The notion of jet-setting grew during the so-called golden age of flying from the ‘50s to the ‘70s, when Western economies boomed and boarding a plane held the promise of fine dining and impeccable service. While the images of stewardesses for airlines like Pan Am now feel jarringly sexist and retrograde, the flying experience had an undeniable glamour.
Corporate cost-cutting in the intervening years has eliminated some of the perks and made flying more mundane, but that hasn’t hurt demand. In fact, while worldwide air travel has been on an upward trajectory since 1945, the trend greatly accelerated after 2010 — before being brought down to Earth, so to speak, by the COVID-19 pandemic.

What gets lost in the fervour to fly is just how few people have the wherewithal to do it. In 2017, Dennis Muilenburg, then-CEO of Boeing, told CNBC that less than 20 per cent of the world had ever been on a plane . Muilenburg framed it as a growth opportunity.
Most of that growth in the coming years is likely to come from Asia — thanks largely to a growing middle class in China, Vietnam and the Philippines.
While more people can afford to fly, the question is whether the planet can afford to accommodate more flying — at least with existing jet propulsion technology. Aviation currently accounts for about two per cent of global carbon emissions; as a point of comparison, electricity generation is about 40 per cent and road transport about 20 per cent.
Aviation’s share may not seem that big, but if it were a country, it would be producing more emissions than Germany.
EESI notes that while other sectors may exceed the environmental impact of flying, “passenger air travel was producing the highest and fastest growth of individual emissions before the pandemic.”
A stubborn emissions problem
Thanks to technological advances in renewable energy and battery storage, there has been significant progress in decarbonizing sectors like electricity and ground transportation. But keeping an airplane aloft with something other than a conventional fossil fuel is a different proposition.
Jet fuel is a mix of hydrocarbons, although it is largely based on kerosene. What comes out of an airplane’s exhaust is about 70 per cent carbon dioxide (CO2), but there’s other pollution as well, including soot, sulphates, nitrous oxides and contrails (water vapour). Contrails stay in the atmosphere for a limited time, but under certain conditions, trap infrared rays and produce a warming effect up to three times that of CO2.
The industry has long teased the possibility of cleaner travel, but a couple of developments increased the urgency to act. One was the release of the 2018 report from the UN’s Intergovernmental Panel on Climate Change (IPCC), which said that we had 12 years to enact significant climate action or face “catastrophic” effects.
The other was Swedish climate activist Greta Thunberg, who declared “our house is on fire” at the World Economic Forum in January 2019 and popularized the phrase flygskam (“flight shame”).
Rising public concern about emissions prompted the leading aerospace manufacturers — Airbus, Boeing, Dassault, General Electric, Rolls-Royce, Safran and United Technologies — to issue a rare shared statement at the Paris Airshow in June 2019. In it, they laid out the main planks of their collective climate action plan: reducing emissions by continuing to look for efficiencies in operations; expanding the use of sustainable aviation fuels (SAF); and designing “new aircraft and jet propulsion technology.”
EESI says “the growth of demand for passenger and freight traffic is a central barrier to controlling commercial aviation emissions.”
The statement also noted that “for the last 40 years, aircraft and engine technology has reduced CO2 emissions by a yearly average of over one per cent per passenger mile.”
Air Transat, for example, has put great emphasis on building a fleet “that is as modern and efficient as possible,” said Chrystal Healy, the company’s vice-president of corporate responsibility and ESG (environmental, social and governance). “That’s been our strategic priority over the last couple of years and will continue to be our focus.” This includes the company’s recent deployment of A321neo aircraft, which Healy says produces 15 per cent fewer emissions.
But the figure that matters is absolute emissions — the fact that individual flights are less carbon-polluting is all well and good, but any progress on energy efficiency is being cancelled out by growing demand. As EESI notes , “emissions from aviation have accelerated in recent years as increasing commercial air traffic continued to raise the industry’s contribution to global emissions.”
The International Council on Clean Transportation says that in 2013, commercial aviation produced 707 million tons of global carbon emissions. By 2019, it was 920 million tons, having jumped about 30 per cent in six years.
“The growth of demand for passenger and freight traffic is a central barrier to controlling commercial aviation emissions,” says EESI.
In the travel industry, there has been excited chatter about offsets, which allow people to fund carbon-mitigation projects to countervail their aviation emissions. There are two main categories: carbon removal offsets, which are activities that take emissions out of the atmosphere, such as tree-planting or technologies like carbon capture and storage (CCS) and direct-air capture; and emission reduction offsets, which reduce the amount of carbon that escapes into the atmosphere, through energy efficiency initiatives and land conservation.

UBC’s Adeniyi Asiyanbi, who researches offsets, says their efficacy is “modest at best,” and that they come with “a whole range of problems.”
The big ones are the difficulties with ensuring that emissions reductions are additional (i.e. wouldn’t have happened without the offset initiative) and permanent (e.g. that a forest won’t later be cut down or destroyed by wildfires). Then there’s the more immediate human impact — that is, some carbon offset projects marginalize local communities, which can mean excluding them from their lands. Asiyanbi said research shows many carbon offset initiatives are actually counterproductive, distracting from more effective climate action and hurting people, too.
The industry has its own initiative: the Carbon Offsetting and Reduction Scheme for International Aviation ( CORSIA ), a global initiative in which airlines and other aircraft operators offset any growth in CO2 emissions above 2020 levels. But Asiyanbi points out that it is currently a voluntary scheme. “It doesn’t impose anything on the aviation industry. There are no sanctions. It’s not there to enforce.”
Sola Zheng, a researcher at the San Francisco-based International Council on Clean Transportation, said the emphasis on offsets has led people “to think that offsets are going to be one of the main solutions, when they’re not really solving any problems.”
She pointed out that there are almost no offsets within the airline industry itself. “It’s mostly … other sectors trying to reduce emissions on behalf of the aviation sector.”
Technological challenges
The push to decarbonize has led to a growing emphasis on sustainable aviation fuels (SAF), which Healy says are a “huge part of the industry’s road map to get to carbon neutrality by 2050.”
Air Canada has operated some flights this year from San Francisco to Vancouver, Calgary, Toronto and Montreal using SAF.
SAF is more of a category than a specific formula. For example, most SAF available today is made of fats, oils, and greases (such as cooking oil from McDonald’s) that have been refined and turned into fuel. This is known as first-generation SAF. Second-generation SAF is made up of biomass (which includes algae, animal waste and forest residue) and solid waste.
The International Air Transport Association has said that use of SAF “has been shown to provide significant reductions in overall CO2 lifecycle emissions compared to fossil fuels, up to 80 per cent in some cases.”
Air Canada wouldn’t agree to an interview for this story, but in response to a series of email questions, a spokesperson noted the airline has “long participated in research and development of SAF, with our first flights using a biofuel blend occurring in 2012.” Air Canada is also a founding member of the Canadian Council for Sustainable Aviation Fuels and a signatory to the World Economic Forum’s Clean Skies for Tomorrow 2030 Ambition Statement, whose mission is to “accelerate the supply and use of sustainable aviation fuel to reach 10 per cent of global jet aviation supply by 2030.”
Healy said part of the problem is that there is too little SAF available right now, and none of it is produced in Canada.
While SAF is more expensive than traditional jet fuel, its use is likely to increase — for example, the recent U.S. climate bill includes incentives for airlines to buy more sustainable fuel . There is also a proposal in the European Union for a “blending mandate,” in which jet fuel would contain two per cent SAF in 2025 and gradually ramp up to 63 per cent in 2050.
Another fuel source with promise is hydrogen, but both Air Transat and Air Canada see that as a longer-term development.
Given the current level and planned growth of travel, the progress on alternate fuels such as SAF and hydrogen is “negligible,” said Finlay Asher, a mechanical engineer based in Bristol, England, who spent seven years working on aircraft engine design for Rolls-Royce.

Asher says biofuel currently makes up less than one per cent of jet fuel, and ramping up production of crop-based biofuels would require land-use changes (such as deforestation), which could actually lead to the release of more carbon. He says there are also issues in producing more biofuels from waste sources or “e-fuels” from renewable electricity because of scarce global resources and intense competition from other sectors.
Hydrogen gas, on the other hand, poses a different dilemma. In order to be viable, it needs to be compressed and turned into liquid hydrogen, which means cooling it to cryogenic temperatures of -253 C. This requires complex tanks, Asher says, with insulation, thick walls and a complicated control system. Because the tanks are so large, they increase the weight and drag of the aircraft. Incorporating them would require complete aircraft redesign, and the whole process of design, development and certification “is likely to take decades.”
There is hope for electrified air travel. Earlier this month, Air Canada announced the purchase of 30 electric-hybrid aircraft from Sweden’s Heart Aerospace, which Air Canada CEO Michael Rousseau hailed as “a step forward to our goal of net zero emissions by 2050.”
But as this piece from MIT explains , batteries will need to become significantly more energy-dense if they hope to move people and cargo for great distances. For the foreseeable future, electrified aviation will only be able to accommodate small groups for short distances.
As EESI’s Bresette put it, “It’s going to be a while before me and 200 of my closest friends board an all-electric plane in D.C. and land in Los Angeles.”
The planes Air Canada recently announced will only have capacity for 30 passengers, and won’t be ready for service before 2028.
Asher says that accommodating alternative fuels or new methods of jet propulsion ultimately requires “a radical step-change” in aircraft design.

“Right now, airplanes are still more or less the way they were 50, 60 years ago,” Asher says, referring to the “tube-and-wing structure,” which includes a cylindrical fuselage with wings and engines mounted off the wings. To accommodate hydrogen cooling systems or electric batteries would require investment in developing brand new aircraft, which he says can cost about $20 billion US.
A number of alternative concepts have been floating around the aviation sector in recent years, including the “blended wing” design , which features a wider and more aerodynamic fuselage and utilizes the aircraft’s entire body to produce lift (rather than just the wings). Asher says there are big questions with the concept — including where to put passengers. Such aircraft would also require reconfiguring airport infrastructure, which isn’t currently being planned.
Asher says he joined the aviation sector with the belief that he could help make it more sustainable, but found that there wasn’t much appetite for change.
“What became clear is that the technology was not being advanced as quickly as it needed to be. It was not getting adequate resources,” he said.
The reason, he says, is that “fossil fuel is just super cheap.”
The future of flying
While aviation is having an impact on the environment, the inverse is also true.
As Asher points out, higher air temperature can make it difficult for planes to take off . Climate change is also leading to more turbulence and bigger storms, which can complicate air traffic control. Meanwhile, sea-level rise is imperiling low-lying runways around the world.
So what is the future of aviation?
The industry is quite bullish, projecting continuing growth while aiming for net-zero emissions by 2050. The industry is regulated by the International Civil Aviation Organization (ICAO), a UN agency. Climate Action Tracker, which assesses the emissions targets of both countries and business sectors, says ICAO’s climate goals are “critically insufficient” and “nowhere near Paris Agreement compatible.”
Like a number of airlines, Air Transat touts the idea of “travelling responsibly,” even dedicating a page of its website to it . Indeed, the phrase “responsible tourism” has taken hold in recent years, with a number of sites and blogs dispensing advice that includes reducing plastic waste, respecting wildlife and observing local traditions. The UN has a guide of its own, called “Tips for a Responsible Traveller,” which includes “plan[ning] your transport to cut carbon emissions.”
But none of these sites suggest you stop flying.

Flying less has become a cri du coeur in some quarters. For example, a group called Flyingless touts itself on Twitter as “a petition calling on universities and professional associations to greatly reduce flying.” Greta Thunberg was so committed to reducing her dependence on air travel that she took a zero-carbon racing boat from England to New York to attend the UN climate conference in 2019.
The movement has spent a lot of time trying to convince people to take the train instead of flying. Some governments have rallied around the idea — for example, earlier this year, the French government banned short-haul flights in locales where a train or bus ride under 2½ hours exists. The notion of flying less has gained some awareness, but the growth projections for aviation suggest feelings of flygskam are not widely shared.
Healy said Air Transat really believes in “the positive power of travel.”
“People want to travel, and it’s not for us to tell people what they should or should not do,” she said.
While airlines envision decades of steady business, some observers have imagined a different approach to the seemingly intractable problem of emissions.
One of them is California–based sci-fi author Kim Stanley Robinson, who earned rapturous praise for his 2020 novel The Ministry for the Future , notably from the New York Times and former U.S. president Barack Obama. Drawing on climate science as well as social psychology and economic theory, Robinson’s bracing book has been touted as necessary reading because it raises difficult questions about the challenges ahead. (Robinson even spoke at the COP26 climate summit in Glasgow, Scotland, last November.)
The book is essentially a 500-page thought experiment — namely, how would we respond to a climate disaster on a scale of the Holocaust? Robinson’s novel begins with 20 million people dying in a heat wave in India. The tragedy spurs desperate action, and not all of it is civil. While the United Nations creates a department called the Ministry for the Future, some non-governmental groups take a more extreme approach. Among them is a group of environmental radicals who, in an effort to quickly drive down aviation emissions, use drones to shoot passenger planes out of the sky, effectively scaring the industry into retirement.
Asher doesn’t envision anything quite so chilling. But he says getting through the next decade — which he deems “crucial” in the fight against climate change — calls for a combination of bold regulation and changes to individual behaviour.

He and former pilot Todd Smith felt so strongly about the issue that they established Safe Landing , an organization made up of concerned current and former aviation employees who want airlines to bring down emissions not only to save the planet, but the industry itself.
One way is to reduce the amount of flying done by the rich. The U.K.-based consultancy Yard recently assembled a list of the celebrities with the most emissions from private jets, suggesting the worst offenders were Taylor Swift, boxer Floyd Mayweather and rapper/business mogul Jay-Z.
“We’ve got one per cent [of people] creating 50 per cent of global aviation emissions,” said Smith, who lives on a canal boat in London, England. “This polluting elite either needs to pay more … or [governments should] put in regulation to stop people from flying so much.” Asher suggests that countries could introduce a tax on frequent fliers.
More broadly, many people are suggesting a change in attitude. While most COVID-19 restrictions are no longer in effect, author Emily Thomas said that the period of reduced travel gave us an opportunity to reflect on its necessity.
“I think one of the positive impacts that pandemic lockdowns had on Westerners was reminding us that travel is a privilege, not a right,” said Thomas.
Smith and Asher say that part of what needs to happen to reduce aviation’s effect on the environment is a change in narratives — to push back on the notion, as Smith said, that flying thousands of kilometres to an all-inclusive resort is “the only way to feel human.”
Thomas believes it starts with redefining “travel.”
“There is definitely a tension here, but travel does not equal flying,” she said, noting that humans “have been travelling for thousands of years” and that commercial flight is a relatively new phenomenon.
“There are many other ways to explore the world, and the advantage of travelling by foot, bus or train is that you see more of it as you go along. Even when flying seems necessary, we can consciously reduce it to a minimum.”
Top illustration: CBC News | Editing: Janet Davison
Related Stories

Reducing air travel by small amounts each year could level off the climate impact

Postdoctoral Researcher in Weather and Climate Modelling, University of Oxford
Disclosure statement
Milan Klöwer receives funding from the UK's Natural Environmental Research Council, the Copernicus Programme of the European Commission and the European Research Council.
University of Oxford provides funding as a member of The Conversation UK.
View all partners
Just before the pandemic, aircraft engines were burning one billion litres of fuel a day. But then the number of daily civil aviation flights fell from 110,000 to less than 50,000 during 2020, on average. With the easing of travel restrictions, air traffic is increasing back towards its pre-pandemic peak.
Most world leaders and delegates will have flown to Glasgow to attend COP26 – the 26th annual UN climate change summit – in person. But as they haggle over emissions targets to limit global warming to 1.5°C, and not 3°C or more , aviation is unlikely to be included in them, given the lack of low-carbon alternatives to long-haul flights.
But it should be. In new research , my colleagues and I calculated that if the aviation sector continues to grow on its present trajectory, its jet fuel consumption will have added 0.1˚C to global warming by 2050 – half of it to date, the other half in the next three decades.
Aviation is responsible for 4% of the 1.2°C rise in the global mean temperature we have already experienced since the industrial revolution. Without action to reduce flights, the sector will account for 17% of the remaining 0.3°C left in the 1.5°C temperature target, and 6% of the 0.8°C left to stay within 2°C. Airlines effectively add more to global warming than most countries.
Warming footprints
At the current rate, the world will have warmed by 2°C within three decades . To quantify how different activities contribute to warming, scientists measure carbon emissions. This is because how much the Earth warms is proportional to cumulative carbon emissions in the atmosphere. This is a very good approximation in many cases, but it is inaccurate for emissions caused by aeroplanes travelling at altitudes of up to 12 kilometres.
As well as CO₂, aircraft engines emit nitrogen oxides, water vapour, sulphur and soot, causing contrail cirrus clouds and other complicated chemical reactions in the atmosphere. The sum of these so-called non-CO₂ effects adds more warming on top of the CO₂ emissions. So the total warming footprint of aviation is between two and three times higher than a conventional carbon footprint.

While a large share of a flight’s CO₂ emissions remain in the atmosphere for many thousands of years, the non-CO₂ effects diminish over time, vanishing within about ten years . So any growth in aviation, measured in global jet fuel consumption, has an amplified impact as both CO₂ and non-CO₂ effects add up.
But a decline in aviation can partly reverse some warming, as the non-CO₂ effects disappear over time until only the CO₂ effects remain. Think of the non-CO₂ effects like a bathtub – it fills up when the taps are turned further and further, despite a slow outflow down the plughole. But the same bathtub will eventually empty if the taps are gradually turned down.
The non-CO₂ effects of flights on the atmosphere will slowly disappear if fewer and fewer flights are taken, so that aviation’s contribution to warming eventually levels off. In that situation, the increase from continued CO₂ emissions would balance the fall in non-CO₂ effects, and although aviation would still contribute to climate change, the total warming from both would remain constant over time. How much would aviation need to shrink to level off its influence on global warming?
Our calculations show that flying does not need to stop immediately to prevent aviation’s contribution to global warming expanding. Flying has already caused 0.04°C of warming to date. But with a yearly decrease of 2.5% in jet fuel consumption, currently only achievable with cuts in air traffic, this warming will level off at a constant level over the coming decades.
When do we really need to fly?
COVID-19 had a huge impact on the aviation sector. Air traffic is still approximately 10-20% below pre-pandemic levels, but is rebounding quickly . Politicians should shift subsidies from flying to more sustainable modes of transport, such as train journeys. And there is much more that can be done.

Lockdowns and the shift to remote working made many people rethink the necessity of flying. People resolving to fly less can contribute considerably to reducing the number of unnecessary flights. Combining in-person and virtual attendance in hybrid meetings wherever possible is a great way to support that shift.
Reducing the space that business classes take on aeroplanes is another way to cut the number of flights, as it allows more passengers to travel on one flight.
Not allowing airport expansions could also have a big impact. The UK’s Climate Change Committee, an expert body which advises the UK government, has recommended not expanding airports to align the sector with climate targets. Yet the expansion of Heathrow airport is currently planned to go ahead .
Sustainable aviation fuels, and hydrogen or electric planes, are being developed, but none of these technologies are currently available at the necessary scale. At the moment, there is little chance of the aviation industry meeting any climate targets if it aims for a return to its pre-pandemic rate of growth.

This story is part of The Conversation’s coverage on COP26, the Glasgow climate conference, by experts from around the world. Amid a rising tide of climate news and stories, The Conversation is here to clear the air and make sure you get information you can trust. More.
- Climate change
- Global warming
- 1.5 degrees
Case Management Specialist
Lecturer / Senior Lecturer - Marketing
Assistant Editor - 1 year cadetship
Executive Dean, Faculty of Health
Lecturer/Senior Lecturer, Earth System Science (School of Science)
- climate change
It’s More Than Just Rain and Snow. Climate Change Will Hit Air Travel in Surprising Ways

A version of this story first appeared in the Climate is Everything newsletter. If you’d like sign up to receive this free once-a-week email, click here .
For those watching U.S. air travel spike as the COVID-19 pandemic fades, American Airlines’ recent announcement that it would trim its flight schedule may have come as a bit of a surprise. More and more people have been flying in recent months, and in response airlines have added flights to meet that demand, not taken them away.
American cited several operational reasons for the adjustment, including labor shortages at vendors that resulted from quickly ramping up from pandemic level staffing levels, but unsurprisingly the one I want to focus on here is “unprecedented weather.” In an email, an American spokesperson told me recent bad weather at the airline’s hubs in Miami, Chicago and Detroit had disrupted operations. The company is also monitoring extreme heat in Phoenix and thunderstorms in Dallas and Charlotte, the spokesperson said.
I won’t make the case that this recent spat of bad weather is caused by climate change, but the cancellations across American’s schedule provide a good opportunity to look at how the effects of climate change might make air travel more challenging—both in terms of industry economics and the travel experience—in the coming decades.
Much attention has been paid to airline emissions , but surprisingly the need for the industry to adapt their operations to the challenges of extreme weather has received relatively little consideration. Still, there’s much to think about. A 2016 article in the journal Carbon & Climate Law Review offers a high-level overview: increased precipitation will lead to more frequent delays, extreme heat will damage runways and storm surge could damage infrastructure at a quarter of U.S. airports even under a moderate sea-level rise scenario. And that’s really just a snapshot. The article concludes that “every sector of the air transport industry will be affected.”
Any one of those factors could make for a story on its own. But I want to home in on one area that’s probably less obvious: extreme heat. Flying is one of those experiences where you hardly think about the temperature outside. You sit in an air-conditioned airport, board an often-freezing plane and exit into another air-conditioned terminal. It can be 100°F outside at your origin and 110°F at your destination without you ever taking off your sweater.
Behind the scenes, however, your airline is watching that temperature closely. Warm weather makes the air less dense, requiring planes to move faster to get off the ground. On extremely hot days, airlines often restrict a flight’s weight by cutting the number of passengers or restricting the plane’s cargo load. On rare occasions, extreme heat can lead airlines to cancel flights altogether. In the summer of 2017, American Airlines made news for canceling flights in and out of Phoenix because temperatures were too high for some planes to operate at all.
Even if planes are operating, extreme heat creates problems on the ground, too. In May, American Airlines started operating a cart on the tarmac in Phoenix to deliver water, Gatorade and popsicles to help keep employees from overheating, according to a report from FOX10 Phoenix. In many parts of the globe, particularly in parts of the Middle East, outdoor air temperatures are already approaching a level where staying outside for long periods of time can be unsafe.
Right now, heat-related problems happen rarely enough that even a frequent flier may not notice—but as temperatures rise that will almost certainly change. A 2017 study in the journal Climatic Change found that up to 30% of flights departing at the hottest part of the day may face weight restrictions in the coming decades. It seems safe to bet that we’ll see many more cancellations, too.
Climate change-related disruptions to flight schedules are the ultimate example of a “first-world problem,” and this obviously isn’t the most pressing climate concern. But I think it’s a useful example of how climate change will seep into areas we may not expect at a glance and, without a proactive attempt to address it, make life just a little worse.
More Must-Reads from TIME
- The New Face of Doctor Who
- Putin’s Enemies Are Struggling to Unite
- Women Say They Were Pressured Into Long-Term Birth Control
- Scientists Are Finding Out Just How Toxic Your Stuff Is
- Boredom Makes Us Human
- John Mulaney Has What Late Night Needs
- The 100 Most Influential People of 2024
- Want Weekly Recs on What to Watch, Read, and More? Sign Up for Worth Your Time
Write to Justin Worland at [email protected]

An official website of the United States government
The .gov means it’s official. Federal government websites often end in .gov or .mil. Before sharing sensitive information, make sure you’re on a federal government site.
The site is secure. The https:// ensures that you are connecting to the official website and that any information you provide is encrypted and transmitted securely.
- Publications
- Account settings
Preview improvements coming to the PMC website in October 2024. Learn More or Try it out now .
- Advanced Search
- Journal List
- Springer Nature - PMC COVID-19 Collection
Climate Change and Travel: Harmonizing to Abate Impact
Aisha n. khatib.
Department of Family & Community Medicine, University of Toronto, Toronto, ON Canada
Purpose of Review
With climate change being the single biggest health threat facing humanity, this review aims to identify the climate-sensitive health risks to the traveler and to recognize the role that travel plays in contributing to the detrimental effects of climate change. With this understanding, adaptations for transformational action can be made.
Recent Findings
Travel and tourism, including transportation, food consumption, and accommodation, is responsible for a large percentage of the world’s carbon emissions which is contributing to the climate change crisis at an alarming rate. Climate change is a health emergency that is resulting in a rise of significant health impacts to the traveler including increased heat illnesses; food-, water-, and vector-borne diseases; and increasing risk of exposure to emerging infectious diseases. Patterns of future travel and destination choices are likely to change due to climactic factors such as temperature and extreme weather events, forced migration, degradation, and disappearance of popular and natural tourist destinations.
Global warming is and will continue to alter the landscape of travel medicine with expansion of transmission seasons and geographic ranges of disease, increased risk of infections and harmful marine toxins, and introduction of emerging infections to naïve populations. This will have implications for pre-travel counseling in assessing risk and discussing the environmental influences on travel. Travelers and stakeholders should be engaged in a dialogue to understand their “climate footprint,” to innovate sustainable solutions, and be empowered to make immediate, conscientious, and responsible choices to abate the impact of breaching critical temperature thresholds.
Introduction
Climate change is a health emergency—a declaration that has been made by 39 countries around the world, jurisdictions amounting to a population over 1 billion citizens. Various international reports, most notably the Lancet Countdown, have exposed not only the unabated rise of health impacts from climate change but also the health consequences of delayed action, providing an imperative to immediate efforts to be taken to lessen the damage [ 1 ••, 2 ••, 3 ]. The climate-sensitive health impacts include enhanced conditions for respiratory illnesses, mental health, cardiovascular disease, and premature death [ 1 ••, 3 ]. Extreme weather patterns destabilize communities and reduce access to healthcare. Changing environmental conditions increase the suitability for the transmission of water-borne, air-borne, food-borne, and vector-borne pathogens. Currently, 40% of the world lives in tropical areas already seeded in inequities, and those at the highest risk, in underserved populations in low-income and human development index communities, will disproportionately bear the brunt of the impact. Vulnerable populations, including women, children, the elderly, members of minority groups, and those with chronic diseases and disabilities, are also at the highest risk of suffering [ 1 ••].
Innovation and resources are needed to identify, prepare for, and adapt to the harmful health impacts of climate change. How will climate alter the landscape of travel and tropical medicine? More importantly, how is the way that we travel contributing to these deleterious changes? This review aims to identify the climate-sensitive health risks to the traveler and to recognize the role that travel plays in contributing to the detrimental effects of climate change.
Climate Change 101
The last 7 years have been the warmest years on record, with mean global temperatures rising more than 1.1 °C above pre-industrial levels and edging closer to the limit laid out under the Paris Agreement. To prevent reaching a tipping point threshold that could result in catastrophic losses of human life and natural environments, the Paris Agreement calls for all countries to strive towards a limit of 1.5 °C of global warming through concerted climate action [ 4 ]. The global average temperature increase of 1.1 °C has already heralded increased frequency and magnitude of extreme weather events from heatwaves, droughts, flooding, winter storms, hurricanes, and wildfires [ 2 ••]. Future climate-related risks depend on the rate, peak, and duration of warming and will be much greater if global warming exceeds 1.5 °C [ 2 ••]. Even if global warming stabilized at 1.5 °C by the year 2100, some impacts may be long-lasting or irreversible, such as the destruction of certain vulnerable ecosystems [ 2 ••]. Warming is caused from anthropogenic emissions—to meet the Paris Agreement goals and prevent dangerous levels of global warming, global greenhouse gas emissions must reduce by half within a decade [ 1 ••]. The responsibility will lie on a collective and collaborative examination on how we are individually and as a society contributing to these emissions, and on areas that could be transformed, modified, and adapted to decrease them, thus lessening the impact of climate change.
The Impact of Travel on Climate Change
Tourism is responsible for roughly 8% of the world’s carbon emissions [ 5 ]. The carbon footprint of tourism is comprised by not only transport, but by the energy and commodities purchased by travelers including food, souvenirs, and accommodation [ 5 ]. The majority of this footprint is emitted by visitors from high-income countries, with US travelers at the top of the list, followed by China, Germany, and India. Per capita, small island destinations such as the Maldives, Mauritius, and the Seychelles hold the highest destination-based footprints from international tourism—which comprises up to 80% of their national emissions [ 5 ]. Global carbon movement, embodied in tourism and traveling, is largely a high-income affair, with travelers exerting higher carbon footprints elsewhere than their own country, and with host countries of popular destinations shouldering a higher footprint from visitors than they would exert themselves [ 5 ]. However, there is a delicate balance of economic growth and development that comes attached to tourism in low-income countries that may bear more of the burden. The UNTWO has projected that transport-related CO 2 emissions will grow 25% by 2030 and, recognizing this, has set a basis to scale up climate action to transform tourism to low emission and more efficient operations [ 6 ]. This is catalyzed in the Glasgow Declaration on Climate Action in Tourism, urging signatories about the need to accelerate urgent action, coordination, and commitment [ 7 ]. The COP27 in Egypt also recognized the cost of doing so, and established the “loss and damage” fund to compensate the developing nations most vulnerable to the climate crisis.
Transportation
Today, transportation is tourism’s main source of greenhouse gas emissions, accounting for 5% of all man-made emissions [ 6 , 8 ]. On average, planes and cars generate the most CO 2 per passenger mile, with tour buses, ferries, and trains coming well behind. In recent years prior to the pandemic lockdowns, the number of people traveling internationally skyrocketed as airfare became more affordable. Projections suggest that travel emissions will make up 12% of total greenhouse emissions by 2025 [ 6 ]. Aviation is responsible for 4% of the 1.1 °C rise in the global mean temperature already experienced since the industrial revolution [ 2 ••, 6 ]. To put into perspective, the aviation sector is responsible for 12% of transportation emissions—if it were a nation, it would be among the top 10 global emitters [ 6 ]. The total carbon impact of a single flight can be significant—for instance, it would take an acre of forest a year to absorb the same amount of CO 2 emissions of a one-way flight from London to New York and can be equivalent to going car-free for a year [ 9 ].
The impact on the coronavirus disease pandemic on global air transport was unprecedented, with up to a 74% drop in global passenger numbers in 2020, a fall of 2.7 billion compared to 4.5 billion in 2019 [ 10 ]. During this sharp decline in air travel, carbon dioxide emissions reduced by 5.4% in 2020. However, surprisingly, the amount of CO 2 in the atmosphere continued to grow at about the same rate as in preceding years, and has been attributed to a complex interplay of various factors and atmospheric components [ 11 ]. Despite these findings, the resulting reduction in anthropogenic activity did yield a glimpse into a future where emissions can be curtailed, but unfortunately, there has been a quick return back to 2019 emission levels.
The aviation industry needs to do its part to make a bigger climate impact; however, collectively, individual choices to fly responsibly should also be addressed [ 12 ]. Advice to travelers to limit their carbon footprint when flying can include choosing economy since flying business emits up to three times more carbon as it takes up more space, opting for direct flights when possible, taking a train as an alternative option to a short-haul flight, altogether skipping the flight and using virtual means of connecting, or taking daytime flights instead of the redeye as there is a heat-trapping effect of contrails and cirrus clouds at night, resulting in a higher greenhouse effect [ 13 ]. This small decision could be collectively very impactful, as in 2030, the total number of tourist trips is expected to reach 37.5 billion, of which 17.4 billion will be overnight arrivals—a 45% growth from 2016 [ 6 ]. Of note, recently, in an effort to reduce carbon emissions by planes, France has announced a plan to ban short-haul flights where travelers could alternatively take a train in under 2.5 hours—the first time a country has enacted a law prohibiting flights for environmental reasons [ 14 , 15 ].
Buying carbon offsets is another consideration—carbon offsets are a credit for emission reductions given to one party that can be sold to another stakeholder who are effecting change to compensate for its emissions [ 16 , 17 ]. Carbon offsets are typically measured in tons of CO 2 -equivalents and are bought and sold through international brokers, online retailers, and trading platforms. Buying offsets helps individuals take into account the environmental costs of air travel [ 13 ]. The price per ton of offsets, however, is far below the estimated costs of damage that a ton of carbon pollution will cause via global warming and ocean acidification [ 18 ]. Although carbon offsets are a conscious action to take to mitigate emissions when flying, reductions in flights taken, planning longer trips, and using alternative lower emitting transportation means, such as trains, are still impactful options.
Food Consumption and Wastage
Food production is responsible for roughly one-quarter of the world’s greenhouse gas emissions [ 19 ]. Getting food from farm to table means growing, processing, transporting, packaging, refrigerating, and cooking—all of which require energy and contribute to a meal’s carbon footprint. Travel often multiplies this footprint since people tend to indulge more while abroad or on vacation. Wastage of food in tourism is part of a larger global issue. If food waste were a country, it would be the world’s 3rd largest emitter of CO 2 [ 20 ]. A substantial amount of the food produced for tourism at all-you-can eat hotel buffets and in oversized restaurant portions is discarded [ 21 , 22 ]. When food is wasted, all the emissions generated in the journey of its production were unnecessary. Globally, less than half of hotels compost their food waste. When this food decomposes in landfills, methane is created which is 21 times more potent at warming than carbon dioxide—methane has accounted for up to 30% of global warming since pre-industrial times [ 23 ].
Accommodation
Accommodation accounts for a substantial part of tourism’s greenhouse gas emissions with many establishments wasting energy—intensive air-conditioning is often cited as a major culprit; or entertainment infrastructure built in areas destroying protective carbon sink ecosystems such as forests and mangroves [ 24 ]. The UNWTO concluded that the accommodation sector is responsible for 21% of CO 2 emissions, compared to other tourism contributors [ 25 ]. Accommodation-related emissions could be reduced by reducing energy consumption, increasing infrastructure energy efficiency, using greenery to cool buildings, and switching to renewable energy resources. New technologies adaptations being developed could provide hotel staff with critical data and send alerts to help them manage energy consumption and increase sustainability [ 22 ]. Traveler behavior and expectations, such as daily towel and linen changes, can also substantially contribute to energy consumption and wastage. Empowering travelers to make more sustainable choices when planning accommodation can be a powerful tool for change, but they must also be provided with consistent, reliable information and options to make these informed green decisions [ 26 , 27 ]. Due to widespread regulatory and market policies, accommodation is a sector that has the potential to become carbon–neutral by 2030 if stakeholders strategize for more transformative change [ 24 ].
The Impact of Climate Change on the Traveler
Changes in future patterns of travel and destination choices, sea level rising.
Patterns of future travel are likely to change to due climactic factors. Natural factors that tend to attract travelers to specific destinations are being diminished, such as the bleaching of coral reefs in places like the Great Barrier Reef [ 28 , 29 ]. The thought of the disappearing destination has even led to the recent trend called “last chance tourism,” which, unfortunately, can even further perpetrate the fragile conditions with an influx of climate anxious travelers [ 28 ]. With 2021 setting a new record for ocean heating, rising sea levels are threatening coastal cities, habitats, and popular tourist destinations, with a projected one foot rise by 2050 [ 30 ]. Popular cities such as Jakarta and Rotterdam are planning adaptation measures to cope with prospects of higher sea levels, such as building seawalls, planting mangroves, and rethinking roads [ 31 , 32 ]. The impact will be even more devastating to small island developing states (SIDS), such as Tuvalu and the Marshall Islands, who are already on the frontlines of climate change, facing low-lying flooding and a battering of increasing tropical storms [ 33 ]. Combined, SIDS make up approximately 65 million inhabitants, of which one third live on land less than 5 m above sea level, and where tourism accounts for a substantial economic export, over 50% in SIDS such as the Maldives, Seychelles, and Bahamas [ 34 , 35 ]. In 2019, over 44 million visitors visited SIDS with an injection of USD 55 billion into the tourism sector. A decline in beach tourism in threatened locations highlights the unique financial vulnerability of these islands to changing travel patterns while already facing an existential threat [ 36 , 37 ].
Extreme Weather from Ocean and Atmospheric Warming
Continuous warming of the ocean and atmosphere as a result of climate change is also increasing the number of natural disasters from extreme weather events—including hurricanes, cyclones, wildfires, droughts, and floods [ 36 , 38 ]. These catastrophic events modify the geographic landscape of a location, but also the ecology of pathogens, increasing the proliferation of and exposure to infectious diseases [ 38 ]. Diseases such as cholera, leptospirosis, and diarrheal diseases spread rapidly after storms and floods, putting local populations and travelers at increased risk [ 38 – 41 ]. Synergizing climactic factors intensify the level and frequency of natural disasters, which result in exacerbated outbreaks of disease. This was most recently witnessed in Pakistan after the devastating floods in June 2022, which caused an unprecedented surge of vector-borne diseases such as malaria and dengue, overwhelming the already fragile and damaged country [ 40 ]. Health practitioners and travelers must be made aware of the complex dynamic situation of regions affected by climactic hazards, to prepare for and prevent risk of infection and exposures [ 41 ].
Implications of Increasing Harmful Algal Blooms
Direct health implications can also be attributed to the fallout from ocean warming. Increasing levels of harmful algal blooms (HABS) can lead to human health consequences as well as detrimental effects on tourism and recreation. In coastal zones, swimmers and food gatherers may face closures of contaminated beaches and shellfish areas, which has already occurred in many Northern European countries [ 42 , 43 ]. HABs lead to increased toxin contamination of seafood and shellfish that can cause an array of respiratory, dermatological, neurological, and diarrheal manifestations of illness and even deaths from the various marine toxins [ 44 ]. The effects of one HAB can be wide reaching worldwide through the globalized seafood industry, masking an already underrecognized hazard for travelers [ 44 ]. Alongside the usual and increasing culprits of scombroid, ciguatera, and shellfish poisoning, recent travelers to places such as the Caribbean are for sure to have encountered the 24 million tons of sargassum encroaching onto the once pristine white beaches, an unsightly, stinky, and toxic floating brown macroalgae seaweed that can be several feet deep and cover thousands of square miles of ocean [ 45 , 46 ]. When decomposing, the sargasso releases ammonia and hydrogen sulfide gas, a broad spectrum poison that smells of rotten eggs. Breathing in these toxic gases may cause hypoxic pulmonary, dermatological, and neurocognitive symptoms. In 2018, in Guadeloupe and Martinique, 11,000 cases of suspected sargasso poisoning was reported where patients complained of heart palpitations, shortness of breath, dizziness, vertigo, headache, and skin rashes [ 46 ]. Recent NASA satellite observations revealed an unprecedented belt of the brown macroalgae stretching from West Africa to the Gulf of Mexico and south to Brazil, the biggest seaweed bloom in the world [ 47 ]. As this “Sargasso Sea” continues to chokehold once pristine beautiful beaches, travelers should be advised to not walk on these beaches, and may altogether be changing their itineraries based on Sargassum Watch Systems which have been developed [ 48 , 49 ].
Increasing Temperatures and Heatwaves
Heat waves are one of the deadliest extreme events that are increasing in frequency, intensity, and duration, however are less discussed as a travel concern as they are less visible, more widespread, and deleterious impacts harder to quantify [ 50 ]. Record temperatures in 2020 set record high heatwave exposure among people older than 65 and children younger than 1 year, populations with a higher than average risk of heat-related death [ 1 ••]. Heat is one of the largest weather-related causes of death in high-income countries, with increasing morbidity and mortality in people with cardiopulmonary, age-related vulnerability, and other chronic diseases [ 51 ]. Travel medicine must start incorporating education around risks of unrecognized heat exposures and heat-related illnesses, such as heat stroke, exhaustion, and dehydration, and incorporate heat action plans into their travel consults. With prevention and proper recognition of vulnerable populations, adaptations can be made to incorporate sustainable solutions and effective cooling interventions at the individual and community level [ 52 ]. Many travel itineraries were changed to accommodate earlier or altered locations this year due to extreme heat in various popular destinations; and subsequently, travelers discovered that cancelation policies did not allow for refunds or coverage.
Changes in Disease Epidemiology and Geographic Patterns of Transmission
Geographic expansion of vector-borne diseases.
Climate factors, such as temperature, rainfall, and meteorological events, which are being intensified by the ongoing emission of greenhouse gases, can influence disease epidemiology, thus changing the landscape of travel and tropical-related medicine [ 39 ]. Vector-borne diseases are an example of this, where climate factors can influence vector suitability of habitats for survival, breeding, and transmission [ 53 •]. With many neglected tropical diseases previously confined to subtropical and tropical areas of the world, including Chagas disease, leishmaniasis, malaria, rabies, and snakebites, predictions anticipate changes in geographic range and transmission periods, resulting in disease incursion and emergence in regions and populations previously unaffected [ 54 , 55 ]. In Europe, for example, climate change is thought to be a key factor in the spread of the Asian tiger mosquito Aedes albopictus , the vector which can transmit dengue, chikungunya, and Zika, as well as Phlebotomus sandfly species, which can transmit leishmaniasis [ 55 , 56 ].
Many temperate regions and high-income countries are now suitable for vector-borne disease transmission that were previously not present [ 56 ].
The impact of climate change on vector-borne ecosystems is complex, as it can influence the circulation and dissemination patterns of migratory birds, which can be carrier or reservoir hosts of many mosquito-borne and tick-borne zoonotic pathogens [ 57 ]. The shift in bird migration routes secondary to climate factors is thought to be a key factor in the increasing spread of mosquito-borne West-Nile virus (WNV) and tick-borne zoonotic pathogens such as Lyme disease into parts of Canada and Northern Europe, as well as tick-borne encephalitis into parts of Northern Europe [ 58 ]. With increasing suitability for habitat with climate change, trans-Saharan bird migration from Africa to Europe has also been implicated in the emergence of new zoonotic pathogens in Europe. These include the introduction of the mosquito-borne Usutu virus (USUV) and the dissemination of new tick-borne pathogens such as Crimean-Congo hemorrhagic fever virus, representing novel threats to human health [ 59 , 60 ]. As vector-borne diseases expand into new unchartered territories, surveillance and awareness of changes in disease patterns will be needed; and thorough travel histories will become more clinically relevant and important.
The Threat of Emerging Arboviruses
The Aedes aegypti mosquito, the vector for many arboviral diseases including dengue, chikungunya, yellow fever, and Zika, is sensitive to climate variability, having a higher thermal optimum for viral transmission [ 61 ]. Already in the last two decades, there has been the largest increase in global abundance, with an anticipated increase of 30% by the end of the century in a low carbon emission scenario [ 62 ]. There has been an expansion of geographical distribution of these vectors into more temperate areas, with subsequent increasing cases of travel-related arboviral infections such as chikungunya [ 63 ]. Dengue cases around the world have surged in the last few years, with the largest number of dengue cases ever reported globally in 2019, and with projections that it will impact 60% of the world’s population by 2080—Mexico alone predicted to have a possible 40% increase of annual dengue incidence [ 64 – 67 ]. With autochronous transmission reported in France, Croatia, and the USA, there is threat of ongoing outbreaks in Europe and North America [ 68 ]. Recently, an autochronous case of the Usutu virus, a Culex -borne emerging arbovirus of African origin, was also reported in France [ 69 ]. Similar to WNV, Usutu virus has the potential to become an important human pathogen of concern; with its rapidly expanding geographical distribution, it is an arbovirus on the rise [ 60 ]. Predictions of arboviral shift include further expansion risk of chikungunya into Central and South America, with an estimated increase of 7.5 million cases by mid-century with unmitigated temperature increase [ 54 ]. Over 1.3 billion new people could be exposed to Zika virus risk as thermal suitability for Zika transmission expands into East Africa, high-income North America, East Asia, Western Europe, North Africa, and the Middle East [ 70 ]. Along with the threat of travel-related introduction of these viruses into naïve populations, challenges arise around surveillance, public health management of new outbreaks in already resource-strained systems, underdiagnosis, and inappropriate management of unfamiliar infections by health professionals.
Mosquitoes Reaching New Heights: Elevation
In travel medicine, advice is often given that mosquito-borne virus transmission is considered a minimal risk over elevations of 2000 m. The changing epidemiology of dengue infections in Nepal over the last 20 years has demonstrated a stark geographical expansion of latitude and altitude. The Aedes vectors have since been found in high-altitude areas of Nepal, likely the result of vector habitat expansion due to global warming of mountain areas [ 71 ]. Of note is that Nepal only became endemic to dengue in 2006—the first reported dengue case to Nepal was in 2004, imported from India by a Japanese foreigner [ 71 ]. With over 50,000 cases reported in 2022, Nepal is a prime example of a new emerging disease increasing burden and geographic spread by latitude and elevation, introduced by a traveler, but now also affecting the landscape of novel risk for travelers to the area [ 72 ].
Temperature Variability and Malaria Transmission Risk
The effects of changing temperatures on vectors and subsequent disease transmission are not all the same, which gives variability in predictions of geographic redistribution of disease. Thermal performance curves are used to predict the way temperature can affect and shift vector and host physiology and the ability to adapt to climate-mediated ecosystem changes [ 58 ]. For example, malaria transmission by the Anopheles gambiae mosquito peaks at 25 °C, whereas dengue transmission by Aedes aegypti peaks at 29 °C [ 73 , 74 •]. The warming temperatures in the tropics, could therefore, drive a shift in climates more suitable to malaria transmission, such as in sub-Saharan Africa, to those more suitable to arboviruses. In this “Battle of the Buzz” as climate suitability increases for arboviruses, these underrecognized emerging diseases could expand and overtake the public health burden of malaria in Africa [ 73 ]. Some models of malaria vector and pathogen suitability have projected shifts depending on the region within Africa, and some have projected expansion to higher altitudes in Southern and Eastern Africa, Asia, Latin America, and the Middle East [ 41 , 75 ]. There will need to be increased research, surveillance, awareness, and education around these emerging diseases for locals, travelers, and the scientific community [ 76 ].
The Great Climate Migration
We cannot talk about travel and climate change without recognizing migration as one of the defining occurrences of our time, often redistributing the fabric of the quilt of our societies. The single greatest impact of climate change could be on human migration [ 43 ]. Migration has many drivers, including political, economic, social, cultural, and environmental factors [ 77 ••]. Climate change can be the main precipitating event, but can also interact with other factors to be an influential force [ 77 ••]. Climate disruption is expected to uproot over 200 million migrants by 2050, those forcibly displaced referred to as “climate migrants” or debatably “climate refugees,” with Sub-Saharan Africa, South Asia, and Latin America being the three regions most heavily affected [ 78 ]. But migration can also be considered to be an adaptation strategy in response to the consequences of climate change, with concerted efforts between and within nations harmonizing to abate impact [ 77 ••, 79 ]. These significant shifts in population distributions via migration and travel, whether forced or not, can also introduce novel pathogens to naïve populations, as has been witnessed for example by the importation of chikungunya into Italy; coronaviruses internationally via air travel; the Zika virus epidemic in the Americas; schistosomiasis in Corsica, France; and most recently, the outbreaks and spread of monkeypox globally [ 70 , 77 ••, 80 – 84 ]. As we progress through the shifting climate, we will continue to see an ever-increasing interplay of the role that travel, migration, and globalization have on the dispersion and introduction of emerging infectious diseases, combined with climate variability and increasing suitability, altering the geographic distribution as we know it.
The Climate Change-Inequality Nexus
Traveler privileges are tipping the scales of inequality as the number of people who can afford to travel grows alongside tourism’s environmental footprint. Between 2010 and 2020, climate-related disasters killed fifteen times more people in highly vulnerable countries, which were responsible for less than 3% of global emissions, than in the wealthiest countries [ 2 ••]. Between 2030 and 2050, climate change is expected to cause 250,000 additional deaths per year due to malaria, diarrhea, and heat stress [ 3 ]. The 46 least developed countries that make up 40% of the world’s poorest are highly vulnerable to these compounded shocks, being disproportionately affected by and at the forefront of the climate crisis [ 85 , 86 ]. There is a great opportunity to combine the overarching framework of the Sustainable Development Goals (SDG) and how they can relate to choices for responsible travel—by examining the areas of climate action, life below water, responsible consumption, decent work and economic growth, reduced inequalities, sustaining cities and communities, and developing partnerships for the goals [ 87 , 88 •]. There is a fine interplay, dependency, and domino effect of factors—even recognizing the deleterious role that high-income travelers can have on vulnerable impoverished tourist destinations must be supported with strategies to improve health and education, reduce inequalities and wastage, and spur economic growth, all while tackling climate change and working to preserve fragile ecosystems.
Practical Implications for Pre-travel Counseling?
Risk, in the context of travel medicine, refers to the possibility of harm during the course of travel. Travel medicine is based on assessing a traveler’s risk at destination and the concept of taking measures to reduce risk. As climate changes the landscape of travel risks due to global warming, understanding the major climate-associated health implications faced by travelers will be pivotal to educating and preparing them ( 41 ) Discussing air pollution linked to respiratory exacerbations, heat illnesses and associated morbidity linked to rising temperatures, and keeping up-to-date with the changing epidemiology of vector-borne diseases and emerging infectious diseases will be necessary.
Proposals to reduce the “climate footprint” of a traveler—the beneficial or detrimental influence that can be had on another person or community in relation to climate factors our actions and choices impact—should be addressed. From measuring carbon emissions, to ethical and behavioral considerations in methods and frequency of travel, to serving as sentinels and vehicles for the spread of disease, creating awareness of the “climate footprint” of a traveler, how it can be measured, and how it can be addressed should be integrated into the pre-travel consultation. By promoting education and ethical travel choices to decrease emissions, our goal should be to create a more sustainable future for destinations, communities, and travelers.
Conclusion: Harmonizing to Abate Impact
We are witnessing a climate crisis which cannot be ignored as we increasingly experience its destructive effects. As we emerge from the pandemic, we are well-suited to take advantage of this unique moment in time to address some of the greatest systemic climate challenges caused by the acceleration of travel and tourism in recent years. Now, more than ever, there is a need to examine the impact that we as travelers have on ecosystems, economies, populations, and future generations. Sustainability and responsibility need to be interwoven and embedded within the framework of travel medicine as well as developing a collaborative platform to discourse innovative and adaptive solutions. By being examples leading innovation and change, we can hope to have a positive and beneficial butterfly effect in the actions that we take. We are at a critical juncture that is beyond using incremental measures to adapt but requiring transformative change at every level of society. Although the task at hand can seem daunting, thousands of small individual choices and actions will summate to transformative outcomes and necessary change. Engaging stakeholders, industry, individuals, travelers, and the scientific community will be monumental in assessing the projected situation, establishing goalposts, discarding current habits of consumption, and replacing them with inventive, integrative, and harmonizing actions to abate the impact of climate change.
Acknowledgements
I would like to thank and acknowledge Dr. Edward Xie, Dr. Archna Gupta, and Dr. Lin Chen for their contributions in peer review, idea creation, and expert guidance.
Compliance with Ethical Standards
Aisha Khatib is Chair of the Responsible Travel Interest Group of the International Society of Travel Medicine, and a voting member of CATMAT- the Committee to Advise on Tropical Medicine and Travel, an expert advisory body to the Public Health Agency of Canada.
This article does not contain any studies with human or animal subjects performed by any of the authors.
This article is part of the Topical Collection on Tropical, Travel and Emerging Infections
Publisher's Note
Springer Nature remains neutral with regard to jurisdictional claims in published maps and institutional affiliations.
Papers of particular interest, published recently, have been highlighted as: • Of importance •• Of major importance
Cars, planes, trains: where do CO₂ emissions from transport come from?
Transport accounts for around one-fifth of global co₂ emissions. three-quarters of this is from road transport..
Transport accounts for around one-fifth of global carbon dioxide (CO 2 ) emissions — 24% if we only consider CO 2 emissions from energy. 1
How do these emissions break down? Are cars, trucks, planes, or trains the dominant sources?
This chart shows global transport emissions in 2018. The data is sourced from the International Energy Agency (IEA) .
Road travel accounts for three-quarters of transport emissions. Most of this comes from passenger vehicles — cars and buses — contributing 45.1%. The other 29.4% comes from trucks carrying freight.
Since the entire transport sector accounts for 21% of total emissions, and road transport accounts for three-quarters of transport emissions, it follows that transport accounts for 15% of total CO 2 emissions.
Aviation — while it often gets the most attention in discussions on action against climate change — accounts for only 11.6% of transport emissions. It emits just under one billion tonnes of CO 2 each year — around 2.5% of total global emissions [we look at air travel's role in climate change in more detail in another article ] . International shipping contributes a similar amount, at 10.6%.
Rail travel and freight emit very little — only 1% of transport emissions. Other transport — mainly the movement of materials such as water, oil, and gas via pipelines — is responsible for 2.2%.

Towards zero-carbon transport: how can we expect the sector’s CO 2 emissions to change in the future?
Transport demand is expected to grow worldwide in the coming decades as the global population increases, incomes rise, and more people can afford cars, trains, and flights. In its Energy Technology Perspectives report, the International Energy Agency (IEA) expects global transport (measured in passenger kilometers) to double, car ownership rates to increase by 60%, and demand for passenger and freight aviation to triple by 2070. 2 Combined, these factors would result in a large increase in transport emissions.
However, major technological innovations can help offset this rise in demand. As the world shifts towards lower-carbon electricity sources, the rise of electric vehicles offers a viable option to reduce emissions from passenger vehicles.
This is reflected in the IEA’s Energy Technology Perspective report, which outlines its “Sustainable Development Scenario” for reaching net-zero CO2 emissions from global energy by 2070. The visualization shows the pathways for the different elements of the transport sector in this optimistic scenario.
We see that some of these sub-sectors could decarbonize with electrification and hydrogen technologies within decades. The IEA scenario assumes the phase-out of emissions from motorcycles by 2040, rail by 2050, and small trucks by 2060. Although emissions from cars and buses will not be completely eliminated until 2070, it expects many regions, including the European Union, United States, China, and Japan, to have phased out conventional vehicles as early as 2040.
Other transport sectors will be much more difficult to decarbonize.
In a paper published in Science , Steven Davis and colleagues looked at our options across sectors to reach a net-zero emissions energy system. 3 They highlighted long-distance road freight (large trucks), aviation, and shipping as particularly difficult to eliminate. The potential for hydrogen as a fuel or batteries to run planes, ships, and large trucks is limited by the range and power required; the size and weight of batteries or hydrogen fuel tanks would be much larger and heavier than current combustion engines. 4
So, despite falling by three-quarters in the visualized scenario, emissions from these sub-sectors would still make transport the largest contributor to energy-related emissions in 2070. To reach net zero for the energy sector, these emissions would have to be offset by ‘negative emissions’ (e.g., the capture and storage of carbon from bioenergy or direct air capture ) from other parts of the energy system.
In the IEA’s net-zero scenario, nearly two-thirds of the emissions reductions come from technologies that are not yet commercially available. As the IEA states, “Reducing CO 2 emissions in the transport sector over the next half-century will be a formidable task.” 2
Global CO2 emissions from transport in the IEA's Sustainable Development Scenario to 2070 2

The World Resource Institute ’s Climate Data Explorer provides data from CAIT on the breakdown of emissions by sector. In 2016, global CO 2 emissions (including land use) were 36.7 billion tonnes of CO 2 ; emissions from transport were 7.9 billion tonnes of CO 2 . Transport, therefore, accounted for 7.9 / 36.7 = 21% of global emissions.
The IEA looks at CO 2 emissions from energy production alone — in 2018, it reported 33.5 billion tonnes of energy-related CO 2 [hence, transport accounted for 8 billion / 33.5 billion = 24% of energy-related emissions.
IEA (2020), Energy Technology Perspectives 2020 , IEA, Paris.
Davis, S. J., Lewis, N. S., Shaner, M., Aggarwal, S., Arent, D., Azevedo, I. L., ... & Clack, C. T. (2018). Net-zero emissions energy systems . Science , 360(6396).
Cecere, D., Giacomazzi, E., & Ingenito, A. (2014). A review on hydrogen industrial aerospace applications . International Journal of Hydrogen Energy , 39 (20), 10731-10747.
Fulton, L. M., Lynd, L. R., Körner, A., Greene, N., & Tonachel, L. R. (2015). The need for biofuels as part of a low carbon energy future . Biofuels, Bioproducts and Biorefining , 9(5), 476-483.
Cite this work
Our articles and data visualizations rely on work from many different people and organizations. When citing this article, please also cite the underlying data sources. This article can be cited as:
BibTeX citation
Reuse this work freely
All visualizations, data, and code produced by Our World in Data are completely open access under the Creative Commons BY license . You have the permission to use, distribute, and reproduce these in any medium, provided the source and authors are credited.
The data produced by third parties and made available by Our World in Data is subject to the license terms from the original third-party authors. We will always indicate the original source of the data in our documentation, so you should always check the license of any such third-party data before use and redistribution.
All of our charts can be embedded in any site.
Our World in Data is free and accessible for everyone.
Help us do this work by making a donation.

Aviation’s contribution to global warming higher than expected
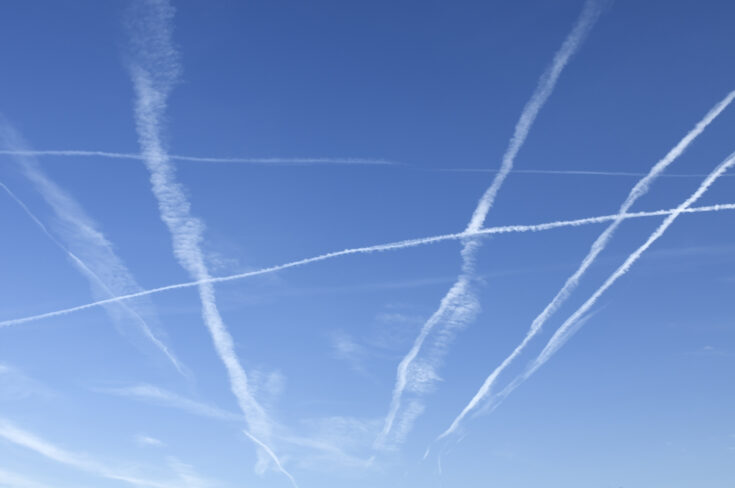
4 November 2021
Major new study reveals that aviation could consume up to one-sixth of the remaining temperature budget to limit warming to 1.5˚C.
Aviation is responsible for more global warming than implied by its carbon footprint alone.
According to new research funded published today, aviation could consume up one-sixth of the remaining temperature budget required to limit warming to 1.5˚C by 2050. The article, published in Environmental Research Letters, suggests that emissions produced by the aviation industry must be reduced each year if the sector’s emissions are not to increase warming further.
The study was part-funded by the Natural Environment Research Council (NERC) and NERC’s National Centre for Earth Observation (NCEO) with research conducted by scientists from the Science and Technology Facilities Council’s (STFC) RAL Space.
Contributing to global warming
Given that aviation is widely recognised as a sector which is challenging to decarbonise, this research will inform the discussion about aviation’s ‘fair share’ of future warming.
The researchers behind the study developed a simple technique for quantifying the temperature contribution of historical aviation emissions. This included both CO2 and non-CO2 impacts. The study also projects future warming due to aviation based on a range of possible solutions to the climate crisis. The researchers of the study are based at:
- University of Oxford
- Manchester Metropolitan University
Tackling global warming
The aviation industry has only recently begun to tackle the warming effect of flying, and this study is timely for quantifying that impact.
The solutions discussed in this study, such as moving to alternative fuels, present a clear pathway to minimising warming but these will take time to implement. In the short-term, there are actions that the industry can take right now.
Dr Simon Proud, of the NCEO and STFC RAL Space, said:
A ban on fuel tankering, where aircraft carry more fuel than they need, and hence burn extra fuel, to save the cost of refuelling at the destination, would reduce CO2 emissions in Europe alone by almost one million tonnes.
Other solutions were discussed, including more efficient air traffic control and minimising holding patterns at airports.
Download the research paper on IOP Science .
Further information
The study was part-funded by:
- NERC, grant number NE/V00946X/1
- UK Research and Innovation (UKRI)
- the Department for Transport
- the European Union’s Horizon 2020 Research and Innovation Action ACACIA, under grant agreement number 875036.
Top image: Credit: pic4you / Getty Images
Share this page
- Share this page on Twitter
- Share this page on LinkedIn
- Share this page on Facebook
This is the website for UKRI: our seven research councils, Research England and Innovate UK. Let us know if you have feedback or would like to help improve our online products and services .
Thank you for visiting nature.com. You are using a browser version with limited support for CSS. To obtain the best experience, we recommend you use a more up to date browser (or turn off compatibility mode in Internet Explorer). In the meantime, to ensure continued support, we are displaying the site without styles and JavaScript.
- View all journals
- My Account Login
- Explore content
- About the journal
- Publish with us
- Sign up for alerts
- Open access
- Published: 10 May 2024
Alternative climate metrics to the Global Warming Potential are more suitable for assessing aviation non-CO 2 effects
- Liam Megill ORCID: orcid.org/0000-0002-4199-6962 1 , 2 ,
- Kathrin Deck 2 &
- Volker Grewe ORCID: orcid.org/0000-0002-8012-6783 1 , 2
Communications Earth & Environment volume 5 , Article number: 249 ( 2024 ) Cite this article
651 Accesses
13 Altmetric
Metrics details
- Atmospheric science
- Climate change
A growing body of research has highlighted the major contribution of aviation non-CO 2 emissions and effects to anthropogenic climate change. Regulation of these emissions, for example in the EU Emissions Trading System, requires the use of a climate metric. However, choosing a suitable climate metric is challenging due to the high uncertainties of aviation non-CO 2 climate impacts, their variability in atmospheric lifetimes and their dependence on emission location and altitude. Here we use AirClim to explore alternatives to the conventional Global Warming Potential (GWP) by analysing the neutrality, temporal stability, compatibility and simplicity of existing climate metrics and perform a trade-off. We find that using the temperature-based Average Temperature Response (ATR) or using an Efficacy-weighted GWP (EGWP) would enable a more accurate assessment of existing as well as future aircraft powered by novel aviation fuels.
The carbon dioxide removal gap

2023 summer warmth unparalleled over the past 2,000 years

The economic commitment of climate change
Introduction.
The aviation industry contributes to anthropogenic climate change through CO 2 and non-CO 2 emissions. Recent studies have underscored the significance of aviation non-CO 2 emissions, which are now thought to be responsible for around two-thirds of the total warming from aviation 1 . Of primary importance is the release of nitrogen oxides (NO x ) 2 , 3 , 4 , 5 , 6 , water vapour 7 , 8 and aerosols 9 , 10 , 11 , 12 , and also the formation of contrails 13 , 14 , 15 , 16 , 17 , 18 . The EU Parliament recently adopted legislation (Directive 2023/958 of May 10, 2023 amending Directive 2003/87/EC) that aims to revise the EU Emissions Trading System (ETS) for aviation, inter alia requiring the European Commission to include aviation non-CO 2 effects in a monitoring, reporting and verification (MRV) framework and, if deemed appropriate, expand the scope of the ETS to include aviation non-CO 2 effects by the end of 2027. Such implementation requires the use of a climate metric, which relates non-CO 2 emissions and effects to their consequences on the climate and/or on society 19 , 20 , 21 , 22 . To maintain compatibility with market-based or offsetting schemes such as the ETS, climate metrics are often used as exchange rates, expressing non-CO 2 emissions on a common scale with CO 2 emissions. This single-basket approach can simplify climate negotiations and the implementation of climate policies 22 .
However, establishing an adequate equivalence is not trivial and there is currently no consensus on which climate metric is most appropriate for aviation. In international climate policy, the most commonly used climate metric is the Global Warming Potential (GWP) 19 , 23 , although it has been heavily criticised, primarily due to its dependence on the time horizon 20 , 24 , 25 , 26 , 27 . The choice of climate metric for aviation climate policy is further complicated because aviation non-CO 2 emissions and effects have highly varying atmospheric lifetimes and efficacies 28 , are dependent on the emission time, altitude and location 29 , 30 and their impacts on the climate have a high degree of uncertainty 1 , 31 . Furthermore, since each climate metric uses a different climate indicator (e.g., stratospheric-adjusted radiative forcing or global mean near-surface temperature change) 32 and calculation method, a climate metric can inherently and inadvertently place emphasis on certain aircraft design choices, emission species or effects. The choice of climate metric is thus an important consideration for all stakeholders to ensure that the implementation of climate policy results in the desired reduction of the aviation industry’s impact on climate and on society 22 , 32 .
In this paper, we explore the applicability of existing, physical climate metrics to the aviation industry. Specifically, we analyse the compatibility to aircraft design and aviation policy, methodological simplicity, neutrality and stability of the following conventional climate metrics: Radiative Forcing (RF) and the Radiative Forcing Index (RFI—relative RF) 33 , 34 , GWP 19 , 23 , Global Temperature Change Potential (GTP) 35 , Integrated GTP (iGTP) 36 and Average Temperature Response (ATR) 37 . The performance of a recently proposed, unconventional method that relates the changes in emission rates of short-lived species to pulses of CO 2 , denoted GWP* 38 , 39 , 40 , is also evaluated. We further analyse derivatives of the GWP and GWP* that are weighted by the efficacy, which we denote the Efficacy-weighted Global Warming Potential (EGWP) and EGWP* respectively. We find that, compared to the dominant GWP, a more accurate assessment of existing as well as future aircraft powered by novel aviation fuels would be enabled through the introduction of the ATR or EGWP into climate policy. We recommend further research into the potential use of the EGWP and into new efficacy estimates for aviation non-CO 2 emissions.
Development of climate metric requirements
Climate metrics are used in both their absolute form and relative to CO 2 . In aviation, absolute climate metrics have two primary use cases: in trajectory optimisation, where aircraft are re-routed to avoid climate-sensitive regions 41 , 42 ; and in aircraft design, where the climate metric can be part of the design trade-off process 43 . Relative metrics are primarily used at a policy level, notably to calculate CO 2 -equivalent emissions and multipliers in single-basket emissions trading schemes such as the ETS 19 , 22 .
From these use cases, we identify the following main requirements for climate metrics used for aviation. Aviation climate metrics shall:
Neutrally represent the chosen climate indicator (REQ 1) 32 , 44 . Value judgements should be left to policymakers and should not be built into climate metrics. Therefore, a climate metric should not exhibit any inherent bias towards specific aircraft design changes.
Be temporally stable (REQ 2) 45 . For aviation policy, it should be possible to use climate metrics to monitor how well the industry is performing through annual and quarterly reports. The results shown by a climate metric, and thus the emission offsetting cost, should not vary to the extent that policymakers cannot gauge the effectiveness of their policies, and airlines and other stakeholders cannot estimate their offsetting cost.
Be compatible with existing climate policy (REQ 3) 45 . A new climate metric must still be able to perform the same functions in the current climate policy context.
Be simple to understand and implement (REQ 4) 20 , 21 , 45 . Non-specialists should be able to understand how a climate metric is calculated and be able to correctly interpret what its results show.
In the following, we analyse each requirement individually and recommend the best-suited climate metric based on the results. We also analyse the impact of the time horizon on the results. We perform our analyses using the climate-chemistry response model AirClim 46 , 47 , which provides yearly global mean radiative forcing and temperature change values from spatially resolved aviation scenarios for CO 2 , water vapour, contrails and NO x -induced changes in ozone (short and long-term) and methane. For the purposes of analysing climate metrics with time horizons in the order of years, the responses of other very short-lived species such as aerosols are expected and assumed to be qualitatively the same as for contrails.
Note that in this paper, we add an A to denote an absolute climate metric (i.e., AGWP, AEGWP, AGTP, iAGTP) and use rATR to denote the relative ATR (to CO 2 ). The GWP* and EGWP* do not have absolute and relative forms. Where necessary for clarification, we also use P-, F- and S- to denote climate metrics calculated using a pulse, fleet or total aviation industry emission scenario, respectively.
REQ 1: climate metric neutrality with respect to aviation emissions
To assess the neutrality of climate metrics for aircraft design, the peak and average total temperatures and climate metric values of potential future fleets are compared. A wide range of narrowbody fleets are generated using a Monte Carlo simulation of various high-level aircraft parameters, including the use of conventional as well as novel aviation fuels such as SAF and hydrogen. The fleets are analysed using the climate-chemistry response model AirClim 46 , 47 , as described in “Methods” (cf. Table 3). The neutrality of each climate metric is gauged by the frequency f of incorrect fleet pairs—defined here as when the signs of the differences in peak/average temperature (Δ T ) and total climate metric value (CM) between any two fleets i and j do not match—compared to the total number of fleet pairs (cf. the method used by Grewe et al. 48 ):
where N = 10,000 is the total number of fleets. Figure 1 shows the frequency of incorrect fleet pairs as a function of the time horizon H ; example results for a single time horizon H = 100 are shown in Supplementary Fig. 1 .

Shown is the frequency of incorrect fleet pairs, corresponding to those where the signs of the peak/average temperature change and climate metric change do not match, as a function of the time horizon for the peak temperature ( a ) and 20-, 50- and 100-year average temperature ( b – d ) climate objectives. Each climate metric is represented by a different combination of colour, line style and marker. Values are available between 5 and 100 years with a time horizon step of 5 years; however, markers are shown every 10 years for clarity.
In general, the similarity shown in Fig. 1 between the results for all climate metrics and climate objectives suggest that the peak temperature is also a good indicator for the average temperature and vice versa over a wide range of time horizons. The endpoint climate metrics F-RF and F-AGTP show a clear dependence on the time horizon and hence shape of the temporal emission profile (temporal evolution of yearly emissions per species). This demonstrates that a single value of radiative forcing or temperature at a time in the future is not a good indicator of the peak or average temperature. Since the radiative forcing from a number of aviation non-CO 2 effects, such as the warming effect from the NO x -induced short-term increase in ozone (e.g., ref. 1 ), has dissipated at large time horizons, the F-RF in particular can have low or altogether no sensitivity to a number of aircraft and engine design changes, leading to a high rate of incorrect fleet pairs. The integrated climate metrics F-AGWP, F-AEGWP and F-iAGTP/F-ATR, in comparison, have a memory of these previous emissions and are less dependent on the temporal emission profile.
The F-AGWP and F-GWP* show largely linear responses for peak and average temperature, particularly for time horizons above 60 years, but in general have higher frequencies of incorrect fleet pairs than climate metrics based on temperature or using efficacy. The F-EGWP* has a similarly low dependence on the time horizon with a lower frequency of incorrect fleet pairs, demonstrating almost ideal behaviour in this context. Whilst the F-iAGTP/F-ATR has a clear minimum at 70 years for peak temperature and at 20, 50 and 100 years for the corresponding average temperatures, it generally has a frequency of incorrect fleet pairs of less than 2%. The F-AEGWP performs very similarly, surpassing 2% error frequency only for the 20-year average temperature, and has clear minima at slightly lower time horizons: 55, 15, 45 and 80 years, respectively.
REQ 2: temporal stability
The temporal stability of climate metrics is judged using CO 2 -eq trajectories for the full aviation industry. In this work, we use the CORSIA and FP2050 scenarios developed by Grewe et al. 49 as examples. The CORSIA scenario assumes business as usual, but that CO 2 emissions are offset beyond 2020; whereas the FP2050 scenario makes use of the Flightpath 2050 targets: 75% CO 2 and 90% NO x reduction by 2050. Figure 2 shows the CO 2 -eq emissions calculated for both scenarios using each climate metric with a 100-year time horizon. Two elements of the responses are highlighted here.

Shown are the CO 2 -eq emissions calculated using each climate metric with a 100-year time horizon for the CORSIA ( a ) and FP2050 ( b ) scenarios. Each climate metric is represented by a different combination of colour, line style and marker for clarity. Also shown is the fuel use (red dashed line) and temperature (solid black line) response for each emission species calculated using AirClim for the CORSIA ( c ) and the FP2050 ( d ) scenarios. All values are calculated on a yearly basis—the markers for each species are differently spaced such that overlapping lines can more easily be identified.
First, the total CO 2 -eq values calculated using the endpoint S-RFI and S-GTP climate metrics are very similar, although as the emission rate (rate of change of yearly emissions over time) reduces around the year 2020 in the FP2050 scenario the results begin to drift apart. The RFI and GTP can thus be seen to be stable for the analysed full aviation emissions. However, both climate metrics can struggle to show qualitatively the same response for pulse and constant emissions (see e.g., ref. 50 , their Fig. 3.3), depending on the chosen time horizon.
The S-GWP and S-iGTP/S-rATR show very similar responses; the S-EGWP also produces similar, albeit generally lower results. The similarity between the S-GWP and S-iGTP/S-rATR potentially allows for species-dependent conversion factors and reduces the political capital required to switch from the standard GWP to either the iGTP or rATR in climate policy. This is a somewhat surprisingly result, since the bases for the climate metric calculations differ, affecting the contributions of individual species to the total CO 2 -eq: The GWP is RF-based, whereas the ATR is temperature-based. As a result, the GWP emphasises contrail cirrus, and the ATR the warming effect of NO x -induced ozone (see Supplementary Fig. 2) . Nevertheless, for full aviation scenarios assuming Jet-A1 fuel, the differing contributions seem to balance out. It is, however, likely that the introduction of novel propulsion technologies and fuels, which change the emission indices relative to one another, will result in a divergence of the total CO 2 -eq emissions calculated by both metrics. The rATR would then likely more closely match the EGWP than the GWP. Further research could analyse the response from different models and emission inventories to check the validity of conversion factors, in particular for novel aviation fuels.
A second noticeable element is the rapid deviation of the S-GWP* and S-EGWP* from the response shown by all other climate metrics in both scenarios. The GWP* calculation method uses an average of the previous 20 years of radiative forcing and is closely tied to the emission rate given by the scenario. Therefore, small changes in the emission rate, in the years 2020 and 2050 in the CORSIA scenario, result in large changes in the CO 2 -eq trajectory. A policymaker using the GWP* or EGWP* method to monitor CO 2 -eq emissions between 2030 and 2050 could incorrectly assume that the impact of aviation is reducing, when in actuality only the emission rate has decreased.
This instability is particularly problematic for the FP2050 scenario. Whilst the values from all other climate metrics largely correspond to the reducing fuel use, the S-GWP* and S-EGWP* show negative CO 2 -eq emissions between 2050 and 2080. Whilst this behaviour is useful for representing the temperature using a cumulative integral, negative CO 2 -eq values could easily be misinterpreted as a sign that aviation is causing an active cooling. The magnitude of the negative CO 2 -eq values is also disproportionately large compared to the shallow peak shown in the temperature.
REQ 3: compatibility with existing climate policy
To be compatible with existing climate policy means that a climate metric can be used in current climate frameworks and methods. These have generally been established on the basis of the GWP, which has become the most commonly used climate metric. There is thus a natural bias towards climate metrics that behave in a similar manner to the GWP. For aviation, this functionally means that any alternative to the GWP must be able to (1) calculate the temporal trajectories of CO 2 -eq emissions; and (2) calculate single values for fleets and individual flights, the latter of which is necessary for the introduction of aviation non-CO 2 emissions into the ETS. The climate metrics RF, GWP, EGWP, GTP, iGTP and ATR are able to perform these functions. However, the GWP* and EGWP* struggle to provide a single value for an individual fleet or flight.
Rather than providing a single value for a given time horizon, the GWP* method provides a temporal trajectory for each emission species, as shown in Fig. 3 for a simple fleet temporal emission profile. If used as a climate metric, for example, to compare this fleet to another, there is no obvious point along the temporal trajectory to choose. Indeed, the choice of which point to use is itself a trade-off between different emission species. Therefore, whilst the GWP* method is useful for certain technical discussions, it should be seen as a model rather than a metric, as previously argued by Meinshausen and Nicholls 45 , and should not be viewed as a potential replacement for the GWP in aviation policy.

The inset figure shows the temporal emission profile; the main figure the CO 2 -eq response for each species (colours). For the comparison of fleets in this study (F-GWP*), the peak total value is used, in this example occurring in the year 2050. Note that the total value is dominated by the contrail impact and that different species have their peaks at later times. Therefore, the choice of which value to use is itself a trade-off between different emission species.
REQ 4: simplicity
The endpoint climate metrics RF and GTP are clearly the easiest to understand. It is straightforward to determine how these climate metrics behave for different time horizons, background emissions scenarios and fuel scenarios. Integrated climate metrics—GWP, EGWP, iGTP and ATR—are more complex and it can be difficult to ascertain the impacts of individual effects and species on the results. The least simple to understand and implement are the GWP* and EGWP*: Their behaviour can be puzzling even for simple temporal emission profiles and can show initially counter-intuitive results, such as the negative emissions in Fig. 2 .
In comparison to temperature-based climate metrics (GTP, iGTP, ATR), climate metrics based on radiative forcing (RF, GWP) are easier to implement since they do not need a full climate or carbon-cycle model. The EGWP requires efficacy values and is thus more complex. However, the demand on computational time depends on which model is used to calculate the climate metric values. The GWP* and EGWP* are RF-based climate metrics, but they do use the AGWP for CO 2 , which would need to be defined as a standard value or calculated for a given scenario. In addition, these metrics require the temporal emission profile twenty years prior to any value, since the method uses a 20-year running average. This could potentially complicate the implementation of the GWP* method.
Choice of climate metric and time horizon
An overview of the performance of all analysed climate metrics is shown in Table 1 . It is clear that the choice of climate metric must be the result of a trade-off. Based on our analysis and definition of requirements, the ATR and EGWP can be seen to perform best. Here, we inspect in more detail the advantages and disadvantages of these metrics in comparison to the GWP and investigate their dependence on the time horizon. We note that the ATR and iAGTP differ only in the division of the time horizon; in their relative forms, the rATR and iGTP are identical. However, the ATR is chosen rather than the iAGTP because the division by the time horizon improves the stability of the absolute climate metric responses.
The ATR and EGWP perform similarly well in the pairwise fleet analysis (REQ 1) for the peak and average temperature climate indicators, as well as in analysis on temporal stability (REQ 2). The rATR 100 produces CO 2 -eq emissions that very closely match those calculated using the GWP 100 , potentially easing the introduction of the ATR in climate policy (REQ 3); introduction of the EGWP is even simpler since it is only a derivative of the GWP. Finally, although the concept of an average temperature change is simple to understand for non-specialists, it can be difficult to identify the impacts of specific effects on results. In comparison to the GWP, the EGWP and in particular the ATR as a temperature-based metric, include more climatic processes, but thus also more assumptions and uncertainties. Implementation of both climate metrics can thus be seen as complex (REQ 4). Further work is required to better understand the benefits and potential downsides of the EGWP in other contexts. Further research into best estimates of the efficacy would also be beneficial.
The dependence of the GWP, EGWP and ATR on the time horizon is shown in Fig. 4 for three different emission scenarios. Individual overviews for each of these metrics and the GTP are provided in Supplementary Figs. 3–6 . The inclusion of the efficacy in the EGWP is evident from the lower panel of the figure, affecting the relative importance of ozone and contrails in particular. The results of the RF-based EGWP now much more closely match those of the temperature-based ATR. Nevertheless, the total relative metric values and thus calculated CO 2 -eq emissions of the GWP, EGWP and ATR are very similar, especially for large time horizons. In general, the sensitivity of all three metrics to the time horizon, represented by the gradient of the relative metric values, decreases with increasing time horizon. Using a low time horizon, for example, 20 years, would require particular justification: Why was 20 years chosen rather than say 15, 25 or even 19 years? Instead, the responses suggest that larger time horizons are most suitable for integrated climate metrics, greater than around 70 years. This is particularly true for the ATR, which requires larger time horizons to properly account for the delay in the temperature response of the atmosphere.

Shown are the responses from the GWP (solid line), EGWP (dashed line) and rATR (dotted line), which in its relative form is equivalent to the iGTP. The top row shows the total metric value relative to CO 2 ; the bottom row the responses calculated for each species (colours) relative to the total. Three temporal emission profiles are used, for which the fuel usage profiles are shown in the inset plots: a pulse emission (P-) in ( a , d ); a fleet emission (F-) in ( b , e ) and a 1% increasing emission (I-) in ( c , f ). Each response is shown for the Shared Socioeconomic Pathway SSP2-4.5 with margins (shading) for scenarios SSP1 to SSP5, which are used as the background emissions scenarios in AirClim.
Our analyses demonstrate that the selection of a climate metric plays a crucial role in ensuring that implemented climate policies effectively reduce the aviation industry’s impact on the climate. In the fleet pairing analysis, we illustrate that climate metrics can have inherent trade-offs and favour certain aircraft designs over others. These inherent biases are undesirable since value judgements should be left to policy decision-making and not embedded into climate metrics.
The choice of climate metric is always the result of a trade-off. Due to the historical dominance of the GWP, there is a natural bias towards climate metrics that behave in a similar manner. However, our research clearly suggests that there are derivatives and alternatives that outperform the GWP for aviation. We require that a suitable climate metric displays neutrality with respect to different emission species; exhibits temporal stability; is compatible with existing climate policy; and is simple to understand and implement. These requirements are in line with those stated by others 20 , 45 . Based on these requirements, we identify the Efficacy-weighted Global Warming Potential (EGWP) and Average Temperature Response (ATR) as the most appropriate climate metrics for aircraft design and aviation policy. Both metrics are stable and can monitor the impact of the aviation industry using CO 2 -equivalents effectively. They also do not favour specific emission species for both peak and average temperature climate indicators across a wide range of time horizons and emission scenarios.
Whilst the ATR as a temperature-based climate metric has the potential to include more climatic processes and be more relevant for temperature-based targets than the GWP, the larger number of assumptions and uncertainties must also be considered. The EGWP may, therefore, be a useful compromise for policymakers, in that it can more accurately represent the climate impact of aviation whilst still using the GWP methodology. Further research is recommended into the advantages and potential disadvantages of using the EGWP. If the ATR were to be chosen, it would benefit from the close match of the total CO 2 -eq emissions calculated by the S-rATR 100 and S-GWP 100 , despite the differences in contributions of individual species. The S-EGWP 100 , for its part, also produces similar results. However, it is likely that the total emissions calculated by the ATR and GWP will diverge with the introduction of novel propulsion technologies and fuels such as hydrogen since the relative contributions of the non-CO 2 emissions will change.
Determining an appropriate time horizon for both the EGWP and ATR remains a challenge. The time horizon is a trade-off between incorporating the long-term response to an emission and ensuring the predictability and accuracy of a future emission scenario. We find that integrated climate metrics generally require larger time horizons to account for the atmospheric radiative forcing and temperature adjustment. If a short time horizon is chosen, policymakers must provide sufficient justification for the choice. Alternatively, values for different time horizons could be provided together, as proposed in ref. 27 , although this complicates the calculation of CO 2 -eq emissions, for example in the upcoming ETS revision.
The accuracy of our results could be improved by using real aircraft designs: Since design parameters are chosen randomly within a given range, some fleets may not be physically feasible. However, since we used the same method of randomly choosing parameters, any additional incorrect fleet pairings caused by this limitation are assumed to cancel out and not impact our conclusions. Similarly, given the wide range of potential aircraft designs analysed in this study, it is unlikely that the choice of climate model, AirClim, has influenced the results significantly. Verification with another climate model may enhance our understanding of the results.
Ultimately, the most suitable climate metric and corresponding time horizon must be determined by policymakers depending on the policy and climate objective, the emission scenario, and whether a relative or absolute climate metric is required. Based on a general set of requirements suitable for policymaking, our findings endorse the use of the ATR and EGWP with a time horizon greater than 70 years for aircraft design and aviation policy to assess the long-term climate impact of aviation. However, the choice of climate metric does not have to be contentious or controversial: As our analysis and the numerous previous studies have demonstrated, tools exist with which the performance of any climate metric can be analysed and potential shortcomings and pitfalls identified, such that these can be addressed in climate policy.
Climate metric calculation methods
The calculation methods for all climate metrics are given in Table 2 . These methods require a time series of radiative forcing (RF) and resulting temperature change Δ T . The calculation methods of the EGWP, ATR/iGTP and GWP*/EGWP* are described in more detail below. In this research, we use the climate-chemistry response model AirClim 46 , 47 to calculate the RF and Δ T responses of individual aircraft fleets using data from the DLR WeCare project 51 , and of the full global fleet using scenarios developed by Grewe et al. 49 . These are described in more detail in subsequent sections. For ease of comparison, we use the Shared Socioeconomic Pathway SSP2-4.5 52 as the default background emissions scenario for our analyses, but vary between SSP1 to SSP5 in the multivariate fleet analysis. AirClim is an extension to the linear response model for CO 2 developed by Sausen and Schumann 53 and combines emission data with pre-calculated altitude- and latitude-dependent data obtained from steady-state simulations with the E39/CA 54 climate-chemistry model (for ozone, methane, water vapour and contrails) and ECHAM4-CCMod 55 (for contrail cirrus). It was chosen for this research due to its low computational cost and flexibility.
EGWP—The Efficacy-weighted Global Warming Potential (EGWP) was developed as a derivative of the GWP. It aims to introduce the efficacy of non-CO 2 emissions into the GWP method, such that the results obtained by the GWP more closely match those of temperature-based climate metrics. The EGWP for a single species i is then the GWP of that species multiplied by its efficacy r i , taken from ref. 28 (their Table 1). We note that this calculation method is still quite uncertain, in particular for contrail cirrus 56 , although it is not expected to affect the results of this study. Another potential approach to calculate the EGWP would be to use the Effective Radiative Forcing (ERF) and corresponding efficacies \(r{{\prime} }_{{{{{{{{\rm{i}}}}}}}}}\) . Further work is required to analyse the performance of these two climate metrics and to develop better estimates of the efficacies for aviation emissions.
ATR—The Average Temperature Response (ATR) was initially developed by Dallara et al. 37 specifically for aircraft design. Initially, it included a weighting function and used an infinite time horizon H . However, the infinite time horizon in particular made it inappropriate for global fuel scenarios, for example. Since its inception, therefore, the ATR has been repurposed and is now generally used as the average temperature change over a given time horizon, as shown in Table 2 . The weighting function is also no longer used. The relative ATR is denoted rATR in this research for clarity. Note that this definition of the ATR is related to the iAGTP by: \({{{{{{{{\rm{ATR}}}}}}}}}_{H}={{{{{{{{\rm{iAGTP}}}}}}}}}_{H}/H\) .
GWP*—Since emission rates are meaningless for NO x -induced aviation effects (O 3 , long-term CH 4 reduction and the Primary Mode Ozone (PMO) effect) and for contrails, the GWP* methodology must be adapted to use radiative forcing. This equivalent calculation is proposed in the initial development of the GWP* by Allen et al. 38 and is modified using the improvements suggested by Cain et al. 39 and Smith et al. 40 to obtain:
where \({E}_{{{{{{{{{\rm{CO}}}}}}}}}_{2}-{{{{{{{\rm{we}}}}}}}}}(t)\) are CO 2 -warming equivalent emissions as a function of time, ΔRF the change in radiative forcing over the previous Δ t = 20 years, \(\overline{{{{{{{{\rm{RF}}}}}}}}}\) the running average of RF and \({{{{{{{{\rm{AGWP}}}}}}}}}_{H({{{{{{{{\rm{CO}}}}}}}}}_{2})}\) the AGWP of a CO 2 pulse at a time horizon of H years. The above equation differs to the one used by Lee et al. 1 only by the multiplication by g ( s ), which was introduced in the same year by Smith et al. 40 to improve consistency with the linear models used for climate metric calculations. In this research, we use s = 0.75 to be consistent with Smith et al. 40 . However, we note that this value was calculated for methane (CH 4 ) and thus may not be optimal for other aviation non-CO 2 emissions and effects.
The EGWP* is a climate metric developed as part of this research as a derivative of the GWP*. Similarly to the EGWP, it makes use of the efficacy r i , also taken from ref. 28 , to more closely match the results obtained by temperature-based climate metrics. The GWP* methodology is adapted by replacing RF i with RF i × r i .
The GWP* and EGWP* differ from the other climate metrics considered in this study in that they are flow-based climate metrics: The GWP* method does not provide a single value over a specific time horizon. Instead, it provides a CO 2 -eq value as a function of time, as shown in Fig. 3 (main text). To estimate the impact of a fleet or flight, a certain point along the temporal trajectory must be chosen. It can be argued that for the analysis of the peak temperature, the peak CO 2 -eq value should be chosen. However, the time at which the peak occurs differs per species, and can also differ per fleet, thereby raising the question whether the climate metric values of each fleet are showing the same thing and are thus intercomparable. In the example shown in the Figure, the peak total CO 2 -eq value is dominated by the contrail impact—all other emissions have their peaks at a later time. However, since no other point could be identified as appropriate, in this research we use time of the peak total CO 2 -eq value for fleet comparisons—in Fig. 3 thus the values in 2050.
Development of fuel scenarios
This research is based on the CORSIA and Flightpath 2050 (FP2050) fuel scenarios developed by Grewe et al. 49 . Since time horizons of up to 100 years are analysed, the scenarios needed to be extended. For this research, they have been extended until the year 2200, assuming a 0.5% annual growth rate after the year 2100. The scenarios are developed to test climate metrics and have not been evaluated for reliability and accuracy.
Fleet pairing analysis
The fleets used in this research are theoretical and characterised with a set of input parameters in AirClim, chosen uniformly from ranges shown in Table 3 . The parameter ranges are based on expected technological pathways developed by Grewe et al. 49 , within the Clean Sky 2 Technology Evaluator 57 and by the “Hydrogen-powered aviation” report by the Clean Hydrogen Joint Undertaking (2020, https://doi.org/10.2843/766989 ). The contrail distance modifier mentioned in the Table is a multiplier for the total cruise distance for which contrails form, which is an AirClim input. In this context, a factor below unity corresponds to aircraft flying further to avoid climate-sensitive regions and, therefore, contrail formation. As a result, the reduction in contrail distance is coupled with an increase in fuel burn, estimated from ref. 58 to be of the ratio −15%:1% contrail distance to fuel burn up to a contrail distance reduction of 60% (contrail distance modifier of 40%), which is approximately the end of the quasi-linear region of the Pareto fronts calculated. For fleets using fuels other than Jet-A1, the emissions parameters are further modified according to Table 4 . Here, the contrail reduction is assumed to correspond to changes in the exhaust composition due to the use of different fuels. We note that the data in both tables are a simplification and that comprehensive data is not yet available for different fuel types. However, since our objective is to provide a wide range of potential future fleets, this simplification is deemed appropriate and should not affect the results of this research.
For each fleet, a constant production rate is assumed, expected to last 30 years. Production is assumed to begin after 2030, approximately on par with the expected introduction of the next generation of single-aisle aircraft and new fuels such as hydrogen according to the analyses of Grewe et al. 49 . The exact year of introduction of new fleets is, however, not relevant to the outcome of this study and is thus varied. Each aircraft is further assumed to have a lifetime of 35 years with no hull losses. A single-aisle aircraft about the size of the Airbus A320 is chosen for reference. For simplicity, the fuel use of this fleet is taken to be 40% of Category 4 of the DLR WeCare project 51 , characterised by aircraft with seat numbers between 152 and 201. A total of 10,000 fleets are simulated using AirClim.
Data availability
All scenario data and AirClim simulation results used in this study are available in the 4TU.ResearchData repository https://doi.org/10.4121/344e24ad-b2f5-4ed9-8d49-6efa2081d30c .
Code availability
The Jupyter notebooks (Python) used to create the scenarios, generate the multivariate fleets and analyse the data in this study are provided in the 4TU.ResearchData repository https://doi.org/10.4121/344e24ad-b2f5-4ed9-8d49-6efa2081d30c . The software code AirClim is confidential proprietary information of the DLR and cannot be made available to the public or readers without restrictions. Licensing of the code to third parties is conditioned upon the prior conclusion of a licensing agreement with the DLR. Qualified researchers can request an agreement on reasonable request from the corresponding author.
Lee, D. et al. The contribution of global aviation to anthropogenic climate forcing for 2000 to 2018. Atmos. Environ. 244 , 117834 (2021).
Article CAS Google Scholar
Fuglestvedt, J. et al. Climatic forcing of nitrogen oxides through changes in tropospheric ozone and methane; global 3D model studies. Atmos. Environ. 33 , 961–977 (1999).
Grewe, V., Dameris, M., Fichter, C. & Sausen, R. Impact of aircraft NOx emissions. Part 1: interactively coupled climate-chemistry simulations and sensitivities to climate-chemistry feedback, lightning and model resolution. Meteorologische Zeitschrift 11 , 177–186 (2002).
Article Google Scholar
Stevenson, D. S. et al. Radiative forcing from aircraft NOx emissions: mechanisms and seasonal dependence. J. Geophys. Res. 109 , D17307 (2004).
Myhre, G. et al. Radiative forcing due to changes in ozone and methane caused by the transport sector. Atmos. Environ. 45 , 387–394 (2011).
Köhler, M., Rädel, G., Shine, K., Rogers, H. & Pyle, J. Latitudinal variation of the effect of aviation NOx emissions on atmospheric ozone and methane and related climate metrics. Atmos. Environ. 64 , 1–9 (2013).
Frömming, C. et al. Aviation-induced radiative forcing and surface temperature change in dependency of the emission altitude. J. Geophys. Res. Atmos. 117 , D19 (2012).
Wilcox, L., Shine, K. & Hoskins, B. Radiative forcing due to aviation water vapour emissions. Atmos. Environ. 63 , 1–13 (2012).
Righi, M., Hendricks, J. & Brinkop, S. The global impact of the transport sectors on aerosol and climate under the Shared Socioeconomic Pathways (SSPs). Earth Syst. Dyn. Discuss. 2023 , 1–34 (2023).
Penner, J. E., Zhou, C., Garnier, A. & Mitchell, D. L. Anthropogenic aerosol indirect effects in cirrus clouds. J. Geophys. Res. Atmos. 123 , 11–652 (2018).
Gettelman, A. & Chen, C. The climate impact of aviation aerosols. Geophys. Res. Lett. 40 , 2785–2789 (2013).
Righi, M., Hendricks, J. & Sausen, R. The global impact of the transport sectors on atmospheric aerosol: Simulations for year 2000 emissions. Atmos. Chem. Phys. 13 , 9939–9970 (2013).
Bickel, M., Ponater, M., Bock, L., Burkhardt, U. & Reineke, S. Estimating the effective radiative forcing of contrail cirrus. J. Clim. 33 , 1991–2005 (2020).
Burkhardt, U., Bock, L. & Bier, A. Mitigating the contrail cirrus climate impact by reducing aircraft soot number emissions. NPJ Clim. Atmos. Sci. 1 , 37 (2018).
Burkhardt, U. & Kärcher, B. Global radiative forcing from contrail cirrus. Nat. Clim. Change 1 , 54–58 (2011).
Schumann, U. et al. Properties of individual contrails: a compilation of observations and some comparisons. Atmos. Chem. Phys. 17 , 403–438 (2017).
Bock, L. & Burkhardt, U. Contrail cirrus radiative forcing for future air traffic. Atmos. Chem. Phys. 19 , 8163–8174 (2019).
Stuber, N. & Forster, P. The impact of diurnal variations of air traffic on contrail radiative forcing. Atmos. Chem. Phys. 7 , 3153–3162 (2007).
Fuglestvedt, J. S. et al. Metrics of climate change:: assessing radiative forcing and emission indices. Clim. Change 58 , 267–331 (2003).
Fuglestvedt, J. et al. Transport impacts on atmosphere and climate: metrics. Atmos. Environ. 44 , 4648–4677 (2010).
Wuebbles, D., Forster, P., Rogers, H. & Herman, R. Issues and uncertainties affecting metrics for aviation impacts on climate. Bull. Am. Meteorol. Soc. 91 , 491–496 (2010).
Tanaka, K., Peters, G. P. & Fuglestvedt, J. S. Policy update: multicomponent climate policy: why do emission metrics matter? Carbon Manag. 1 , 191–197 (2010).
Rodhe, H. A comparison of the contribution of various gases to the greenhouse effect. Science 248 , 1217–1219 (1990).
Manne, A. S. & Richels, R. G. An alternative approach to establishing trade-offs among greenhouse gases. Nature 410 , 675–677 (2001).
Shine, K. P., Berntsen, T. K., Fuglestvedt, J. S., Skeie, R. B. & Stuber, N. Comparing the climate effect of emissions of short- and long-lived climate agents. Philos. Trans. Royal Soc. A: Math. Phys. Eng. Sci. 365 , 1903–1914 (2007).
Allen, M. R. et al. New use of global warming potentials to compare cumulative and short-lived climate pollutants. Nat. Clim. Change 6 , 773–776 (2016).
Ocko, I. B. et al. Unmask temporal trade-offs in climate policy debates. Science 356 , 492–493 (2017).
Ponater, M., Pechtl, S., Sausen, R., Schumann, U. & Hüttig, G. Potential of the cryoplane technology to reduce aircraft climate impact: a state-of-the-art assessment. Atmos. Environ. 40 , 6928–6944 (2006).
Frömming, C. et al. Influence of weather situation on non-CO 2 aviation climate effects: the REACT4C climate change functions. Atmos. Chem. Phys. 21 , 9151–9172 (2021).
Lund, M. T. et al. Emission metrics for quantifying regional climate impacts of aviation. Earth Syst. Dyn. 8 , 547–563 (2017).
Lee, D. et al. Transport impacts on atmosphere and climate: aviation. Atmos. Environ. 44 , 4678–4734 (2010).
Grewe, V. & Dahlmann, K. How ambiguous are climate metrics? And are we prepared to assess and compare the climate impact of new air traffic technologies? Atmos. Environ. 106 , 373–374 (2015).
Penner, J., Lister, D., Griggs, D., Dokken, D. & McFarland, M. (eds) Aviation and the Global Atmosphere (Cambridge University Press, Cambridge, 1999).
Forster, P. M., Shine, K. P. & Stuber, N. It is premature to include non-CO 2 effects of aviation in emission trading schemes. Atmos. Environ. 40 , 1117–1121 (2006).
Shine, K. P., Fuglestvedt, J. S., Hailemariam, K. & Stuber, N. Alternatives to the Global Warming Potential for comparing climate impacts of emissions of greenhouse gases. Clim. Change 68 , 281–302 (2005).
Peters, G. P., Aamaas, B., Berntsen, T. & Fuglestvedt, J. S. The integrated global temperature change potential (iGTP) and relationships between emission metrics. Environ. Res. Lett. 6 , 044021 (2011).
Dallara, E. S., Kroo, I. M. & Waitz, I. A. Metric for comparing lifetime average climate impact of aircraft. AIAA J. 49 , 1600–1613 (2011).
Allen, M. R. et al. A solution to the misrepresentations of CO 2 -equivalent emissions of short-lived climate pollutants under ambitious mitigation. NPJ Clim. Atmos. Sci. 1 , 16 (2018).
Cain, M. et al. Improved calculation of warming-equivalent emissions for short-lived climate pollutants. NPJ Clim. Atmos. Sci. 2 , 29 (2019).
Smith, M. A., Cain, M. & Allen, M. R. Further improvement of warming-equivalent emissions calculation. NPJ Clim. Atmos. Sci. 4 , 19 (2021).
Niklaß, M., Grewe, V., Gollnick, V. & Dahlmann, K. Concept of climate-charged airspaces: a potential policy instrument for internalizing aviation’s climate impact of non-CO 2 effects. Clim. Policy 21 , 1066–1085 (2021).
Grewe, V. et al. Aircraft routing with minimal climate impact: the REACT4C climate cost function modelling approach (V1.0). Geosci. Model Dev. 7 , 175–201 (2014).
Proesmans, P.-J. & Vos, R. Airplane design optimization for minimal global warming impact. J. Aircraft 59 , 1363–1381 (2022).
Rogelj, J. & Schleussner, C.-F. Unintentional unfairness when applying new greenhouse gas emissions metrics at country level. Environ. Res. Lett. 14 , 114039 (2019).
Meinshausen, M. & Nicholls, Z. GWP* is a model, not a metric. Environ. Res. Lett. 17 , 041002 (2022).
Grewe, V. & Stenke, A. AirClim: an efficient tool for climate evaluation of aircraft technology. Atmos. Chem. Phys. 8 , 4621–4639 (2008).
Dahlmann, K., Grewe, V., Frömming, C. & Burkhardt, U. Can we reliably assess climate mitigation options for air traffic scenarios despite large uncertainties in atmospheric processes? Transport. Res. Part D: Transport Environ. 46 , 40–55 (2016).
Grewe, V., Stenke, A., Plohr, M. & Korovkin, V. D. Climate functions for the use in multi-disciplinary optimisation in the pre-design of supersonic business jet. Aeronautical J. 114 , 259–269 (2010).
Grewe, V. et al. Evaluating the climate impact of aviation emission scenarios towards the Paris Agreement including COVID-19 effects. Nat. Commun. 12 , 3841 (2021).
Dahlmann, K. Eine Methode zur effizienten Bewertung von Maßnahmen zur Klimaoptimierung des Luftverkehrs . Ph.D. thesis, LMU München (2011).
Grewe, V. et al. Mitigating the climate impact from aviation: achievements and results of the DLR WeCare project. Aerospace 4 , 34 (2017).
Meinshausen, M. et al. The shared socio-economic pathway (SSP) greenhouse gas concentrations and their extensions to 2500. Geosci. Model Dev. 13 , 3571–3605 (2020).
Sausen, R. & Schumann, U. Estimates of the climate response to aircraft CO 2 and NOx emissions scenarios. Clim. Change 44 , 27–58 (2000).
Stenke, A., Grewe, V. & Ponater, M. Lagrangian transport of water vapor and cloud water in the ECHAM4 GCM and its impact on the cold bias. Clim. Dyn. 31 , 491–506 (2008).
Burkhardt, U. & Kärcher, B. Process-based simulation of contrail cirrus in a global climate model. J. Geophys. Res. 114 , D16 (2009).
Ponater, M., Bickel, M., Bock, L. & Burkhardt, U. Towards determining the contrail cirrus efficacy. Aerospace 8 , 42 (2021).
Gelhausen, M. C., Grimme, W., Junior, A., Lois, C. & Berster, P. Clean Sky 2 Technology Evaluator—results of the first air transport system level assessments. Aerospace 9 , 204 (2022).
Yin, F., Grewe, V., Frömming, C. & Yamashita, H. Impact on flight trajectory characteristics when avoiding the formation of persistent contrails for transatlantic flights. Transport. Res. Part D: Transport Environ. 65 , 466–484 (2018).
Download references
Acknowledgements
The authors thank Dr. Katrin Dahlmann for her suggestions and advice and Dr. Birgit Hassler and Dr. Tina Jurkat-Witschas for providing internal reviews. L.M. is supported by the DINA2030+ project within the sixth Aviation Research Programme of the German Federal Government (LuFo VI-2). K.D. received funding from the Clean Sky 2 Joint Undertaking under the European Union’s Horizon 2020 research and innovation programme under grant agreement No. 865300 (GlowOPT). V.G. received funding from Airbus under the OpenAirClim contract. The funding bodies played no role in the study design, data collection, analysis and interpretation of data, or the writing of this manuscript.
Open Access funding enabled and organized by Projekt DEAL.
Author information
Authors and affiliations.
Deutsches Zentrum für Luft- und Raumfahrt, Institut für Physik der Atmosphäre, Oberpfaffenhofen, Germany
Liam Megill & Volker Grewe
Delft University of Technology, Faculty of Aerospace Engineering, Section Aircraft Noise and Climate Effects, Delft, The Netherlands
Liam Megill, Kathrin Deck & Volker Grewe
You can also search for this author in PubMed Google Scholar
Contributions
Conceptualisation: L.M. and V.G. Methodology, investigation and visualisation: L.M. Supervision: K.D. and V.G. Original draft: L.M. Review and editing: L.M., K.D. and V.G. All authors read and approved the final manuscript.
Corresponding author
Correspondence to Liam Megill .
Ethics declarations
Competing interests.
The authors declare no competing interests.
Peer review
Peer review information.
Communications Earth and Environment thanks Takashi Sekiya and the other, anonymous, reviewer(s) for their contribution to the peer review of this work. Primary Handling Editors: Prabir Patra, Heike Langenberg. A peer review file is available.
Additional information
Publisher’s note Springer Nature remains neutral with regard to jurisdictional claims in published maps and institutional affiliations.
Supplementary information
Supplementary information, peer review file, rights and permissions.
Open Access This article is licensed under a Creative Commons Attribution 4.0 International License, which permits use, sharing, adaptation, distribution and reproduction in any medium or format, as long as you give appropriate credit to the original author(s) and the source, provide a link to the Creative Commons licence, and indicate if changes were made. The images or other third party material in this article are included in the article’s Creative Commons licence, unless indicated otherwise in a credit line to the material. If material is not included in the article’s Creative Commons licence and your intended use is not permitted by statutory regulation or exceeds the permitted use, you will need to obtain permission directly from the copyright holder. To view a copy of this licence, visit http://creativecommons.org/licenses/by/4.0/ .
Reprints and permissions
About this article
Cite this article.
Megill, L., Deck, K. & Grewe, V. Alternative climate metrics to the Global Warming Potential are more suitable for assessing aviation non-CO 2 effects. Commun Earth Environ 5 , 249 (2024). https://doi.org/10.1038/s43247-024-01423-6
Download citation
Received : 22 September 2023
Accepted : 26 April 2024
Published : 10 May 2024
DOI : https://doi.org/10.1038/s43247-024-01423-6
Share this article
Anyone you share the following link with will be able to read this content:
Sorry, a shareable link is not currently available for this article.
Provided by the Springer Nature SharedIt content-sharing initiative
By submitting a comment you agree to abide by our Terms and Community Guidelines . If you find something abusive or that does not comply with our terms or guidelines please flag it as inappropriate.
Quick links
- Explore articles by subject
- Guide to authors
- Editorial policies
Sign up for the Nature Briefing newsletter — what matters in science, free to your inbox daily.


An official website of the United States government
Here’s how you know
Official websites use .gov A .gov website belongs to an official government organization in the United States.
Secure .gov websites use HTTPS A lock ( Lock A locked padlock ) or https:// means you’ve safely connected to the .gov website. Share sensitive information only on official, secure websites.
JavaScript appears to be disabled on this computer. Please click here to see any active alerts .
Climate Change Impacts on Air Quality
Clean air is critical to human health. It is also important for the health of vegetation and crops. 1 It contributes to people’s enjoyment of scenic areas, like national parks and wilderness areas.
The effects of climate change on air quality will continue to vary by region. In many areas of the United States, climate change is expected to worsen harmful ground-level ozone , increase people’s exposure to allergens like pollen, and contribute to worsening air quality. 2 It can also decrease visibility so that it is harder to see into the distance. 3 Changes in the amount of outdoor air pollutants can also affect indoor air quality .

Increased ozone. The 10 warmest years on record have occurred since 2005, with record highs across the globe in 2020. 27 Temperatures are expected to continue rising, and hot, sunny days can increase the amount of ozone at ground level.

Increased Particulate Matter. In 2021, the U.S. Southwest experienced one of the most severe long-term droughts of the past 1,200 years. 28 Dust from droughts can increase particulate matter and cause air quality issues.

Increased indoor pollutants. Extreme weather, such as flooding and storm surge, can damage buildings and allow water or moisture inside. Damp indoor conditions can lead to the growth of harmful pollutants, such as mold and bacteria. 29

Increased wildfires. In 2020, wildfires burned over 10 million acres of land in the United States, the highest-ever amount on record. 30 Wildfire smoke lowers air quality and harms human health.

Increased pollen. Rising temperatures and higher carbon dioxide concentrations related to climate change can lengthen the pollen season and increase the amount of pollen produced by plants. 31
Climate impacts on air quality will depend on what additional measures are taken to reduce air pollution. Regulatory initiatives , partnership programs , and individual actions can all help reduce air pollutants that harm human health, as well as greenhouse gases that contribute to climate change.
Explore the sections on this page to learn more about climate impacts on air quality:
Top Climate Impacts on Air Quality
Air quality and the economy, environmental justice and equity, what we can do, related resources, the link between air quality and climate change.

Climate change can affect air quality, and certain air pollutants can affect climate change. For example, hot sunny days associated with a warming climate can increase ground-level ozone in some areas. 4 Ground-level ozone is also a greenhouse gas that contributes to climate change by trapping heat in the atmosphere. Read more about greenhouse gases and the climate effects of certain air pollutants on the Basics of Climate Change page.
Climate change may affect air quality at both local and regional scales. Three key impacts are described in this section.
1. Outdoor and Indoor Air Pollution

More than 100 million people in the United States live in areas with poor air quality. 5 In many regions of the United States, climate-driven changes in weather conditions, including temperature and precipitation, are expected to increase ground-level ozone and particulate matter (such as windblown dust from droughts or smoke from wildfires). 6 These changes worsen existing air pollution. Exposure to these pollutants can lead to or worsen health problems, such as respiratory and heart diseases.
Climate change can also affect indoor air quality. Increases in outside air pollutants, such as ozone and particulate matter, could lead to higher indoor exposures. 7 These pollutants can enter a building in many ways, including through open doors and windows and ventilation systems.
Mold , dust mites, bacteria, and other indoor pollutants may increase as climate change-related precipitation and storms increase. For example, flood damage can create a damp indoor environment, leading to mold growth. 8 Indoor air pollutants have been linked to heart disease, respiratory diseases such as asthma, and cancer. 9
Air pollution may also damage crops, plants, and forests. 11 For example, when plants absorb large amounts of ground-level ozone, they experience reduced photosynthesis, slower growth, and higher sensitivity to diseases. 12
2. Wildfire Smoke

Climate change has already led to more frequent wildfires and a longer wildfire season. 13 Wildfire smoke pollutes the air, impairing visibility and disrupting outdoor activities. It can also spread hundreds of miles downwind to other regions.
Exposure to wildfire smoke can worsen respiratory illnesses, such as asthma, chronic obstructive pulmonary disease (COPD), and bronchitis. Wildfire smoke exposures have also been linked to premature births. 14
3. Airborne Allergens
A changing climate is expected to cause earlier and longer springs and summers, warmer temperatures, precipitation changes, and higher carbon dioxide concentrations. All of these changes can increase people’s exposure to pollen and other airborne allergens, which in turn can lead to more allergy-related illnesses, such as asthma and hay fever. 15
For more specific examples of climate change impacts in your region, please see the National Climate Assessment .

Cleaner air is closely linked to a healthy economy. For example, good air quality improves Americans’ health and productivity. In 2020 alone, reductions in air pollution prevented more than 230,000 premature deaths, 200,000 heart attacks, 120,000 emergency room visits, and 17 million lost workdays. 16 Working toward cleaner air also creates jobs, advances technologies, and produces billions of dollars for the United States in revenues and exported goods and services.
Many socially vulnerable groups live in industrial or urban areas with high levels of air pollution. 17 , 18 In fact, Black and African Americans individuals are 34% more likely than non-Blacks to live in areas with the highest projected increases in childhood asthma due to climate-related changes in particulate matter. 19 Some people are also more vulnerable to the health impacts of air pollution because they have chronic medical conditions. For example, certain communities of color, low-income groups, Indigenous populations, and immigrant groups have higher rates of heart disease, asthma, and COPD. 20 , 21
Certain populations may also be more vulnerable to air quality impacts because they work outside. For example, farm workers, firefighters, roofers, and construction workers are among those workers whom scientists expect will be affected by air quality impacts from climate change. 22
Both rural and urban low-income populations may live in older buildings that are not well sealed, increasing their exposure to outdoor allergens and pollutants. 23 Older buildings or buildings in poor condition may also take more damage during extreme weather, such as storms and floods. This can lead to damp indoor environments prone to mold, bacteria, and other indoor air contaminants. 24

We can reduce climate and air quality impacts in many ways, including the following:
- Go green. Switch to green power from renewable energy sources like solar, wind, and hydropower to reduce both air pollution and greenhouse gas emissions.
- Reduce air pollution from vehicles. Walking, biking, and taking public transit among other actions can reduce emissions from transportation . These choices can also provide other benefits, such as safer streets.
- Improve air quality at ports. Communities situated near ports—which often include low-income and minority populations—are at a higher risk of air pollution exposure. Communities and stakeholders can work with EPA’s Ports Initiative to improve environmental performance and advance clean technologies at ports. This effort helps people living near ports breathe cleaner air. Check out the Community-Port Collaboration Toolkit for ways communities can get involved.
- Develop urban forests. Planting trees, especially in urban areas and along roads or highways, can help improve air quality. Trees also provide other benefits, such as reducing the impact of urban heat islands .
- Prevent wildfires. Pay attention to weather and drought conditions. Avoid activities involving fire or sparks when it’s dry, hot, and windy to help prevent wildfires .
- Reduce your exposure. Use the Air Quality Index (AQI) to guide outdoor activities. When you see that the AQI is unhealthy, take simple steps to reduce your exposure like choosing less intense activities, take more breaks, and reschedule activities to a time when outdoor air quality is better.
- Improve indoor air quality. Reduce or remove sources of indoor air pollutants whenever possible. For example, consider using portable air purifiers or high-efficiency filters in your heating, ventilation, and air conditioning systems.
Related Climate Indicators
Learn more about some of the key indicators of climate change related to this sector from EPA’s Climate Change Indicators in the United States :
- U.S. Greenhouse Gas Emissions
- Atmospheric Concentrations of Greenhouse Gases
- Ragweed Pollen Season
- Fifth National Climate Assessment , Chapter 14: “Air Quality.”
- Air Topics . Describes how air quality can affect your health and how EPA is working to protect air quality.
- AirNow Air Quality Index . Provides daily information on how clean or polluted your outdoor air is, along with associated health impacts.
- Air Quality Resources for Tribes . Gathers Tribal-related resources from across the federal landscape into a single resource. Includes regulatory, policy, planning, guidance, and other materials for tribes to use.
- Centers for Disease Control and Prevention: Air Quality . Provides information and resources on protecting yourself from air pollutants.
- Environmental Justice Grants and Resources . Manages programs that support communities as they develop solutions to address environmental and health issues, including air quality.
- Drought.gov . Shows current drought conditions in the United States and locations of active wildfires. Developed through a multi-agency partnership.
- Smoke Sense . Crowdsources air quality observations of smoke via the Smoke Sense mobile app. Citizen scientists can report conditions in their area to improve understanding and communication strategies of wildfire impacts.
- EPA’s Heart Healthy Toolkit . Provides information on the link between air quality and heart disease, as well as steps individuals can take to protect their health.
1 Nolte, C.G., et al. (2018). Ch. 13: Air quality . In: Impacts, risks, and adaptation in the United States: Fourth national climate assessment, volume II . U.S. Global Change Research Program, Washington, DC, pp. 513–516.
2 Nolte, C.G., et al. (2018). Ch. 13: Air quality . In: Impacts, risks, and adaptation in the United States: Fourth national climate assessment, volume II . U.S. Global Change Research Program, Washington, DC, pp. 516–517.
3 U.S. Environmental Protection Agency (EPA). (2021). Basic information about visibility . Retrieved 3/18/2022.
4 Nolte, C.G., et al. (2018). Ch. 13: Air quality . In: Impacts, risks, and adaptation in the United States: Fourth national climate assessment, volume II . U.S. Global Change Research Program, Washington, DC, p. 518.
5 Nolte, C.G., et al. (2018). Ch. 13: Air quality . In: Impacts, risks, and adaptation in the United States: Fourth national climate assessment, volume II . U.S. Global Change Research Program, Washington, DC, p. 513.
6 Nolte, C.G., et al. (2018). Ch. 13: Air quality . In: Impacts, risks, and adaptation in the United States: Fourth national climate assessment, volume II . U.S. Global Change Research Program, Washington, DC, p. 516.
7 Nolte, C.G., et al. (2018). Ch. 13: Air quality . In: Impacts, risks, and adaptation in the United States: Fourth national climate assessment, volume II . U.S. Global Change Research Program, Washington, DC, p. 516.
8 EPA. (2021). Indoor air quality . Retrieved 3/18/2022.
9 EPA. (2021). Indoor air quality . Retrieved 3/18/2022.
10 EPA. (2021). Mold and health . Retrieved 3/18/2022.
11 Nolte, C.G., et al. (2018). Ch. 13: Air quality . In: Impacts, risks, and adaptation in the United States: Fourth national climate assessment, volume II . U.S. Global Change Research Program, Washington, DC, p. 513.
12 EPA. (2022). Ecosystem effects of ozone pollution . Retrieved 3/18/2022.
13 Nolte, C.G., et al. (2018). Ch. 13: Air quality . In: Impacts, risks, and adaptation in the United States: Fourth national climate assessment, volume II . U.S. Global Change Research Program, Washington, DC, p. 521.
14 Nolte, C.G., et al. (2018). Ch. 13: Air quality . In: Impacts, risks, and adaptation in the United States: Fourth national climate assessment, volume II . U.S. Global Change Research Program, Washington, DC, pp. 518–519.
15 Nolte, C.G., et al. (2018). Ch. 13: Air quality . In: Impacts, risks, and adaptation in the United States: Fourth national climate assessment, volume II . U.S. Global Change Research Program, Washington, DC, p. 522.
16 EPA. (2022). The Clean Air Act and the economy . Retrieved 3/18/2022.
17 Gamble, J.L., et al. (2016). Ch. 9: Populations of concern . In: The impacts of climate change on human health in the United States: A scientific assessment. U.S. Global Change Research Program, Washington, DC, p. 253.
18 EPA. (2022). Research on health effects from air pollution . Retrieved 3/18/2022.
19 EPA. (2021). Climate change and social vulnerability in the United States: A focus on six impacts . EPA 430-R-21-003, pp. 24—25.
20 Gamble, J.L., et al. (2016). Ch. 9: Populations of concern . In: The impacts of climate change on human health in the United States: A scientific assessment . U.S. Global Change Research Program, Washington, DC, p. 252.
21 EPA. (2021). Power plants and neighboring communities . Retrieved 3/18/2022.
22 Gamble, J.L., et al. (2016). Ch. 9: Populations of concern . In: The impacts of climate change on human health in the United States: A scientific assessment. U.S. Global Change Research Program, Washington, DC, p. 258.
23 Fann, N., et al. (2016). Ch. 3: Air quality impacts . The impacts of climate change on human health in the United States: A scientific assessment . U.S. Global Change Research Program, Washington, DC, pp. 82–83.
24 EPA. (2021). Indoor air quality (IAQ) . Retrieved 3/18/2022.
25 EPA. (2021.) Climate change and social vulnerability in the United States: A focus on six impacts . EPA 430-R-21-003, p. 21. Retrieved 3/18/2022.
26 U.S. Energy Information Administration. Renewables became the second-most prevalent U.S. electricity source in 2020 . Retrieved 3/18/2022.
27 Lindsey, R., & L. Dahlman. (2021). Climate change: Global temperature . National Oceanic and Atmospheric Administration. Retrieved 3/18/2022.
28 Mankin, J.S., et al. (2021). NOAA Drought Task Force report on the 2020–2021 southwestern U.S. drought . National Oceanic and Atmospheric Administration (NOAA) Drought Task Force; NOAA Modeling, Analysis, Predictions and Projections Programs; and National Integrated Drought Information System. Retrieved 5/11/2022.
29 EPA. (2021). Indoor air quality (IAQ) . Retrieved 3/18/2022.
30 National Centers for Environmental Information. (2020). Annual 2020 wildfires report . Retrieved 3/18/2022.
31 Nolte, C.G., et al. (2018). Ch. 13: Air quality . In: Impacts, risks, and adaptation in the United States: Fourth national climate assessment, volume II . U.S. Global Change Research Program, Washington, DC, p. 514.
- Climate Change Impacts Home
- Agriculture and Food Supply
- Air Quality
- Built Environment
- Freshwater Resources
- Ocean and Marine Resources
- Transportation
- Human Health
- State and Regional Impacts
- Climate Equity
- Election 2024
- Entertainment
- Newsletters
- Photography
- Personal Finance
- AP Investigations
- AP Buyline Personal Finance
- AP Buyline Shopping
- Press Releases
- Israel-Hamas War
- Russia-Ukraine War
- Global elections
- Asia Pacific
- Latin America
- Middle East
- Election Results
- Delegate Tracker
- AP & Elections
- Auto Racing
- 2024 Paris Olympic Games
- Movie reviews
- Book reviews
- Personal finance
- Financial Markets
- Business Highlights
- Financial wellness
- Artificial Intelligence
- Social Media
Heat-trapping carbon dioxide and methane levels in the air last year spiked to record highs again
FILE - A flare burns at a well pad Aug. 26, 2021, near Watford City, N.D. The levels of the crucial heat-trapping gases in the atmosphere reached historic highs in 2023, growing at near-record fast paces, according to the U.S. National Oceanic and Atmospheric Administration. (AP Photo/Matthew Brown, File)

- Copy Link copied
The levels of the crucial heat-trapping gases in the atmosphere reached historic highs last year, growing at near-record fast paces, according to the U.S. National Oceanic and Atmospheric Administration.
Carbon dioxide, the most important and abundant of the greenhouse gases caused by humans, rose in 2023 by the third highest amount in 65 years of record keeping, NOAA announced Friday. Scientists are also worried about the rapid rise in atmospheric levels of methane, a shorter-lived but more potent heat-trapping gas. Both jumped 5.5% over the past decade.
The 2.8 parts per million increase in carbon dioxide airborne levels from January 2023 to December, wasn’t as high as the jumps were in 2014 and 2015, but they were larger than every other year since 1959, when precise records started. Carbon dioxide’s average level for 2023 was 419.3 parts per million, up 50% from pre-industrial times.
Last year’s methane’s jump of 11.1 parts per billion was lower than record annual rises from 2020 to 2022. It averaged 1922.6 parts per billion last year. It has risen 3% in just the past five years and jumped 160% from pre-industrial levels showing faster rates of increase than carbon dioxide, said Xin “Lindsay” Lan, the University of Colorado and NOAA atmospheric scientist who did the calculations.
“Methane’s decadal spike should terrify us,” said Stanford University climate scientist Rob Jackson, who heads the Global Carbon Project that tracks worldwide emissions of carbon dioxide but wasn’t part of NOAA’s report. “Fossil fuel pollution is warming natural systems like wetlands and permafrost. Those ecosystems are releasing even more greenhouse gases as they heat up. We’re caught between a rock and a charred place.”
Methane emissions in the atmosphere come from natural wetlands, agriculture, livestock, landfills and leaks and intentional flaring of natural gas in the oil and gas industry.
Methane is responsible for about 30% of the current rise in global temperature , with carbon dioxide to blame for about twice as much, according to the International Energy Agency. Methane traps about 28 times the heat per molecule as carbon dioxide but lasts a decade or so in the atmosphere instead of centuries or thousands of years like carbon dioxide, according to the U.S. Environmental Protection Agency.
Carbon dioxide and methane levels have been higher in the far ancient past, but it was before humans existed.
The third biggest human-caused greenhouse gas, nitrous oxide, jumped 1 part per billion last year to record levels, but the increases were not as high as those in 2020 and 2021. Nitrous oxide, which lasts about a century in the atmosphere, comes from agriculture, burning of fuels, manure and industrial processes , according to the EPA.
“As these numbers show we still have a lot of work to do to make meaningful progress in reducing the amount of greenhouse gases accumulating in the atmosphere,” NOAA Global Monitoring Laboratory Director Vanda Grubisic said in statement.
Companies across the globe last year pledged massive — almost complete — cuts in methane emissions from the oil and gas industry in a new initiative that could trim future rises in temperature by a tenth of a degree Celsius. And the EPA issued a final rule to reduce oil and gas industry generated methane emissions.
But the past five years, methane levels have risen faster than any time in NOAA record-keeping. And recent studies have shown that government efforts to track methane are vastly underestimating the pollution going into the air from the energy industry.
Studies of the specific isotopes of methane in the air show much of the increased methane is from microbes, pointing to spiking emissions from wetlands and perhaps agriculture and landfills, but not as much the energy industry, Lan said.
“I’m still mostly concerned about carbon dioxide emissions,” Lan said.
Carbon dioxide emissions going into the air from burning fossil fuels and making cement hit an all time high last year of 36.8 billion metric tons, twice the amount spewed into the air 40 years ago, according to Global Carbon Project. But about half of what’s coming out of smokestacks and tailpipes are temporarily sucked up and stored by trees and oceans, keeping it out of the atmosphere, Lan said.
Methane doesn’t have that temporary carbon storage that carbon dioxide has, Lan said.
The shift last year from a three-year La Nina, the natural cooling of parts of the central Pacific that changes weather worldwide, to a warm El Nino , played a role in dampening methane’s increasing rate in the air and spiking carbon dioxide levels, Lan said.
That’s because methane’s biggest emissions comes from wetlands, which during a La Nina is wetter in much of the tropics, creating more microbes in the lush growth to release methane, Lan said. The La Nina ended mid year last year, giving way to a strong El Nino.
Carbon dioxide levels in the atmosphere tend to rise higher during hotter El Ninos, but the current one is starting to peter out, Lan said.
Read more of AP’s climate coverage at http://www.apnews.com/climate-and-environment
Follow Seth Borenstein on X at @borenbears
The Associated Press’ climate and environmental coverage receives financial support from multiple private foundations. AP is solely responsible for all content. Find AP’s standards for working with philanthropies, a list of supporters and funded coverage areas at AP.org .

- Today's news
- Reviews and deals
- Climate change
- 2024 election
- Fall allergies
- Health news
- Mental health
- Sexual health
- Family health
- So mini ways
- Unapologetically
- Buying guides
Entertainment
- How to Watch
- My Portfolio
- Latest News
- Stock Market
- Premium News
- Biden Economy
- EV Deep Dive
- Stocks: Most Actives
- Stocks: Gainers
- Stocks: Losers
- Trending Tickers
- World Indices
- US Treasury Bonds
- Top Mutual Funds
- Highest Open Interest
- Highest Implied Volatility
- Stock Comparison
- Advanced Charts
- Currency Converter
- Basic Materials
- Communication Services
- Consumer Cyclical
- Consumer Defensive
- Financial Services
- Industrials
- Real Estate
- Mutual Funds
- Credit cards
- Balance Transfer Cards
- Cash-back Cards
- Rewards Cards
- Travel Cards
- Personal Loans
- Student Loans
- Car Insurance
- Morning Brief
- Market Domination
- Market Domination Overtime
- Opening Bid
- Stocks in Translation
- Lead This Way
- Good Buy or Goodbye?
- Fantasy football
- Pro Pick 'Em
- College Pick 'Em
- Fantasy baseball
- Fantasy hockey
- Fantasy basketball
- Download the app
- Daily fantasy
- Scores and schedules
- GameChannel
- World Baseball Classic
- Premier League
- CONCACAF League
- Champions League
- Motorsports
- Horse racing
- Newsletters
New on Yahoo
- Privacy Dashboard
Yahoo Finance
Travel & tourism's impact on global warming.
G&A's Sustainability Highlights ( 05.01.2024 )
NORTHAMPTON, MA / ACCESSWIRE / May 14, 2024 / Four decades ago the United Nations projected that the travel and tourism industry would be ranked very high among the world's top industry categories for economic impact. Last year, Bloomberg News reported that the World Travel & Tourism Council's data projects the industry's contribution to the world's gross domestic product (GDP) to be about US$16 trillion by the end of the decade, or 12% of total GDP (with $3 trillion of those annual revenues within the United States).
The COVID-19 pandemic did slow down domestic and global travel for two years, but the revenues for the industry are climbing once again. Categories used to assemble the global data for travel and related expenditures included airline travel, hotels and resort stays, train travel, and local spending by tourists in 160 nations.
The economic boom in travel tourism certainly benefits local destinations in both developed and developing countries. But there is a downside cost: it was estimated that the travel and tourism industry's contribution to global GHG emissions was about 8% of the total from 2009 to 2013, based on study results published in Nature Climate Change in July 2018.
One major component was airline travel; the industry returned to profitability in 2023, with the global industry enjoying revenues of almost US800 billion last year, according to the International Air Transport Association (IATA). The airline industry's energy-related emissions have also slightly increased (more revenues=more flights=more emissions), and a growing number of airlines have responded by committing to achieve net zero carbon emissions by 2050.
To help business travelers address their travel-related carbon emissions and make a contribution to GHG reduction, a start-up company - Airwise Travel - is launching a new software dashboard that will enable corporate travel managers to book travel and purchase carbon credits to offset emissions from airline flights, hotels, and other arrangements.
Does it matter to travelers that their business or personal journeys are contributing to the growing volume of carbon emissions? We found interesting survey results out of Germany from Booking.com. One-of-three German travelers apparently do not count "sustainability" as a primary concern when planning or booking flights. These respondents are "tired of constantly hearing about climate change."
The good news: 60% of German travelers do want to travel more sustainably in the next year. Many German travelers, says Bookings.com, feel that their sustainable travel experiences add value to their trips. Almost half of those surveyed feel they become the best version of themselves when they travel sustainably and carry the positivity back home.
We are sharing these survey results in our Top Stories. What are your considerations when you book travel for yourself, or your company travel department makes the arrangements? Are you a sustainable traveler? No doubt travel and tourism will be highlighted in the months ahead as disclosure of carbon emissions becomes mandatory for many large companies.
This is just the introduction of G&A's Sustainability Highlights newsletter this week. Click here to view the full issue.
View additional multimedia and more ESG storytelling from Governance & Accountability Institute, Inc. on 3blmedia.com.
Contact Info: Spokesperson: Governance & Accountability Institute, Inc. Website: https://www.3blmedia.com/profiles/governance-accountability-institute-inc Email: [email protected]
SOURCE: Governance & Accountability Institute, Inc.
View the original press release on accesswire.com
Earth experienced its warmest April on record as US prepares for brutal summer heat
April was the 11th consecutive month with record-breaking global temperatures.
Earth has just experienced its 11th straight warmest month on record -- a preview of the brutal temperatures forecast for the summer, according to scientists.
Last month continued a relentless stretch of record-breaking global temperatures for the planet after it measured as the warmest April on record, according to a monthly climate report by Copernicus , Europe's climate change service, released on Tuesday.
MORE: First heatwave of the year expected to hit Southern states next week
April 2024 saw an average surface air temperature of 15.03 degrees Celsius, or 59.05 degrees Fahrenheit, the report found. The temperature measured at 1.21 degrees Fahrenheit above the 1991 to 2020 average for April, according to the report.
May 2023 through April 2024 was the warmest 12-month stretch on record with a global average temperature of 2.90 degrees Fahrenheit above the 1850 to 1900 pre-industrial average, the report found.

The Paris Agreement goals aim to limit global warming to 1.5 degrees Celsius higher than pre-industrial levels.
Global sea surface temperatures across a majority of the world’s oceans remained at unusually high levels in April 2024, according to the report.
MORE: How you can help combat global warming as the planet reaches 10th consecutive warmest month on record
The average global sea surface temperature for April for the majority of the world's oceans was 21.04 degrees Celsius, or 69.87 degrees Fahrenheit -- the highest value on record for the month of April.
The report comes as the U.S. prepares for brutal heat this summer. The latest National Oceanic and Atmospheric Administration seasonal outlook for the summer months , released in April, shows above average temperatures favored for much of the country between June and August.

The first heat wave of the year is already underway in parts of the South, with blistering temperatures expected from Texas to Florida throughout much of the week.
Trending Reader Picks

Clean source electricity reaches 30% of total
- May 7, 7:11 PM

Dow hits new record high
- May 16, 4:38 PM

Justice Department formally moves to reclassify marijuana as a less dangerous drug in historic shift
- May 16, 1:00 PM
The last time Earth recorded a colder than average year was in 1976 -- 48 years ago -- according to NOAA .
MORE: February marked Earth's 9th consecutive warmest month on record, according to new Copernicus report
El Niño conditions over the equatorial eastern Pacific and greenhouse gas emissions have both contributed to the relentless stretch of new global temperature records. El Niño peaked at the beginning of the year and the sea surface temperatures in the eastern tropical Pacific are now going back towards neutral conditions.
While the El Niño conditions are fading, the warming effects are expected to linger for months , according to scientists.

Several regions around the planet are expected to experience record-breaking average surface air temperatures through the summer as a result of heating influence from the El Niño pattern, according to a study published in Scientific Reports in February.
This increases the odds of more above average and record-breaking global land and ocean temperatures in the near future.
MORE: Why the warming effects of this El Niño event will linger for several months
Such a lengthy stretch of monthly global temperatures records is unusual, but a similar stretch was documented in 2015 and 2016, records show.

Human-amplified global warming is continuing to exacerbate normal climate variations, Carlo Buontempo, director of the Copernicus Climate Change Service, said in a statement.
"Whilst temperature variations associated with natural cycles like El Niño come and go, the extra energy trapped into the ocean and the atmosphere by increasing concentrations of greenhouse gasses will keep pushing the global temperature towards new records," Buontempo said.
The latest forecasts show the current El Niño event officially ending in the coming weeks, transitioning to neutral conditions. La Niña will likely return this summer.
Related Topics

The Latest | Israel says it will send more troops to Rafah, as fighting also rages in Gaza's north
- May 16, 3:34 AM

Webb telescope discovers early black holes merger
- May 16, 11:15 AM
ABC News Live
24/7 coverage of breaking news and live events
- Skip to main content
- Keyboard shortcuts for audio player
The huge solar storm is keeping power grid and satellite operators on edge

Geoff Brumfiel
Willem Marx

NASA's Solar Dynamics Observatory captured this image of solar flares early Saturday afternoon. The National Oceanic and Atmospheric Administration says there have been measurable effects and impacts from the geomagnetic storm. Solar Dynamics Observatory hide caption
NASA's Solar Dynamics Observatory captured this image of solar flares early Saturday afternoon. The National Oceanic and Atmospheric Administration says there have been measurable effects and impacts from the geomagnetic storm.
Planet Earth is getting rocked by the biggest solar storm in decades – and the potential effects have those people in charge of power grids, communications systems and satellites on edge.
The National Oceanic and Atmospheric Administration says there have been measurable effects and impacts from the geomagnetic storm that has been visible as aurora across vast swathes of the Northern Hemisphere. So far though, NOAA has seen no reports of major damage.

The Picture Show
Photos: see the northern lights from rare, solar storm.
There has been some degradation and loss to communication systems that rely on high-frequency radio waves, NOAA told NPR, as well as some preliminary indications of irregularities in power systems.
"Simply put, the power grid operators have been busy since yesterday working to keep proper, regulated current flowing without disruption," said Shawn Dahl, service coordinator for the Boulder, Co.-based Space Weather Prediction Center at NOAA.
NOAA Issues First Severe Geomagnetic Storm Watch Since 2005

- LISTEN & FOLLOW
- Apple Podcasts
- Google Podcasts
- Amazon Music
- Amazon Alexa
Your support helps make our show possible and unlocks access to our sponsor-free feed.
"Satellite operators are also busy monitoring spacecraft health due to the S1-S2 storm taking place along with the severe-extreme geomagnetic storm that continues even now," Dahl added, saying some GPS systems have struggled to lock locations and offered incorrect positions.
NOAA's GOES-16 satellite captured a flare erupting occurred around 2 p.m. EDT on May 9, 2024.
As NOAA had warned late Friday, the Earth has been experiencing a G5, or "Extreme," geomagnetic storm . It's the first G5 storm to hit the planet since 2003, when a similar event temporarily knocked out power in part of Sweden and damaged electrical transformers in South Africa.
The NOAA center predicted that this current storm could induce auroras visible as far south as Northern California and Alabama.
Extreme (G5) geomagnetic conditions have been observed! pic.twitter.com/qLsC8GbWus — NOAA Space Weather Prediction Center (@NWSSWPC) May 10, 2024
Around the world on social media, posters put up photos of bright auroras visible in Russia , Scandinavia , the United Kingdom and continental Europe . Some reported seeing the aurora as far south as Mallorca, Spain .
The source of the solar storm is a cluster of sunspots on the sun's surface that is 17 times the diameter of the Earth. The spots are filled with tangled magnetic fields that can act as slingshots, throwing huge quantities of charged particles towards our planet. These events, known as coronal mass ejections, become more common during the peak of the Sun's 11-year solar cycle.
A powerful solar storm is bringing northern lights to unusual places
Usually, they miss the Earth, but this time, NOAA says several have headed directly toward our planet, and the agency predicted that several waves of flares will continue to slam into the Earth over the next few days.
While the storm has proven to be large, predicting the effects from such incidents can be difficult, Dahl said.
Shocking problems
The most disruptive solar storm ever recorded came in 1859. Known as the "Carrington Event," it generated shimmering auroras that were visible as far south as Mexico and Hawaii. It also fried telegraph systems throughout Europe and North America.

Stronger activity on the sun could bring more displays of the northern lights in 2024
While this geomagnetic storm will not be as strong, the world has grown more reliant on electronics and electrical systems. Depending on the orientation of the storm's magnetic field, it could induce unexpected electrical currents in long-distance power lines — those currents could cause safety systems to flip, triggering temporary power outages in some areas.
my cat just experienced the aurora borealis, one of the world's most radiant natural phenomena... and she doesn't care pic.twitter.com/Ee74FpWHFm — PJ (@kickthepj) May 10, 2024
The storm is also likely to disrupt the ionosphere, a section of Earth's atmosphere filled with charged particles. Some long-distance radio transmissions use the ionosphere to "bounce" signals around the globe, and those signals will likely be disrupted. The particles may also refract and otherwise scramble signals from the global positioning system, according to Rob Steenburgh, a space scientist with NOAA. Those effects can linger for a few days after the storm.
Like Dahl, Steenburgh said it's unclear just how bad the disruptions will be. While we are more dependent than ever on GPS, there are also more satellites in orbit. Moreover, the anomalies from the storm are constantly shifting through the ionosphere like ripples in a pool. "Outages, with any luck, should not be prolonged," Steenburgh said.

What Causes The Northern Lights? Scientists Finally Know For Sure
The radiation from the storm could have other undesirable effects. At high altitudes, it could damage satellites, while at low altitudes, it's likely to increase atmospheric drag, causing some satellites to sink toward the Earth.
The changes to orbits wreak havoc, warns Tuija Pulkkinen, chair of the department of climate and space sciences at the University of Michigan. Since the last solar maximum, companies such as SpaceX have launched thousands of satellites into low Earth orbit. Those satellites will now see their orbits unexpectedly changed.
"There's a lot of companies that haven't seen these kind of space weather effects before," she says.
The International Space Station lies within Earth's magnetosphere, so its astronauts should be mostly protected, Steenburgh says.
In a statement, NASA said that astronauts would not take additional measures to protect themselves. "NASA completed a thorough analysis of recent space weather activity and determined it posed no risk to the crew aboard the International Space Station and no additional precautionary measures are needed," the agency said late Friday.

People visit St Mary's lighthouse in Whitley Bay to see the aurora borealis on Friday in Whitley Bay, England. Ian Forsyth/Getty Images hide caption
People visit St Mary's lighthouse in Whitley Bay to see the aurora borealis on Friday in Whitley Bay, England.
While this storm will undoubtedly keep satellite operators and utilities busy over the next few days, individuals don't really need to do much to get ready.
"As far as what the general public should be doing, hopefully they're not having to do anything," Dahl said. "Weather permitting, they may be visible again tonight." He advised that the largest problem could be a brief blackout, so keeping some flashlights and a radio handy might prove helpful.
I took these photos near Ranfurly in Central Otago, New Zealand. Anyone can use them please spread far and wide. :-) https://t.co/NUWpLiqY2S — Dr Andrew Dickson reform/ACC (@AndrewDickson13) May 10, 2024
And don't forget to go outside and look up, adds Steenburgh. This event's aurora is visible much further south than usual.
A faint aurora can be detected by a modern cell phone camera, he adds, so even if you can't see it with your eyes, try taking a photo of the sky.
The aurora "is really the gift from space weather," he says.
- space weather
- solar flares
- solar storm
A .gov website belongs to an official government organization in the United States.
A lock ( ) or https:// means you've safely connected to the .gov website. Share sensitive information only on official, secure websites.
- CDC's Climate and Health Program
- Building Resilience Against Climate Effects (BRACE) Framework
- Climate and Health Resources
- Climate-Ready States & Cities Initiative
- Climate Effects on Health
- Drought and Your Health
- Drought Communication Toolkit
Air Pollution
What to know.
Climate change is increasing ground-level ozone and particulate matter air pollution in some locations. This leads to many negative impacts on human health.

Health impact
Climate change is projected to harm human health by increasing ground-level ozone and/or particulate matter air pollution in some locations. Ground-level ozone (a key component of smog) is associated with many health problems:
- Decreased lung function
- Increased hospital visits
- Increased emergency room visits for asthma
- Increases in premature deaths
Ozone formation
Factors that affect ozone formation include heat, concentrations of precursor chemicals, and methane emissions. Wildfires, air stagnation, and other factors affect particulate matter concentrations.
Climate change intensifies these factors, projecting higher ozone and particulate matter concentrations in specific regions.
Increases in global temperatures could cause associated increases in premature deaths related to worsened ozone and particle pollution.
Health outcome predictions
By 2050, researchers predict that there could be an increase of 1,000 to 4,300 premature deaths annually in the United States due to the combined effects of ozone and particle pollution. This is assuming no changes in regulations or population characteristics. The impact of climate change on airborne particles is less certain compared to ozone.
The current health costs of ozone pollution, which surpass national standards, have resulted in an estimated $6.5 billion nationwide in 2008. These estimates are based on a U.S. assessment of health impacts from ozone levels between 2000 and 2002.
Watch a short video about air quality changes, and learn what communities can do to prepare .
Air Quality – information and resources on air pollutants, particle pollution, and other relevant topics.
Asthma – guidance on asthma symptoms, triggers, and management.
Air Quality and Asthma Data – Data Explorer – interactive maps, tables, and charts.
Climate Change Decreases the Quality of the Air We Breathe
Climate and Health
CDC's Climate and Health Program supports state, tribal, local, and territorial public health agencies as they prepare for climate change's health impacts.
Polar vortex is 'spinning backwards' above Arctic after major reversal event
Earlier this month, a sudden atmospheric warming event caused the Arctic's polar vortex to reverse its trajectory. The swirling ring of cold air is now spinning in the wrong direction, which has triggered a record-breaking "ozone spike" and could impact global weather patterns.
The polar vortex circling the Arctic is swirling in the wrong direction after surprise warming in the upper atmosphere triggered a major reversal event earlier this month. It is one of the most extreme atmospheric U-turns seen in recent memory.
In the past, disruptions to the polar vortex — a rotating mass of cold air that circles the Arctic — have triggered extremely cold weather and storms across large parts of the U.S..
The current change in the vortex's direction probably won't lead to a similar "big freeze." But the sudden switch-up has caused a record-breaking "ozone spike" above the North Pole.
The polar vortex is most prominent during winter months and extends into the stratosphere — the second layer of the atmosphere up to around 30 miles (50 kilometers) above the surface. The vortex spins counterclockwise with wind speeds of around 155 mph (250 km/h), which is around the same speed as a Category 5 hurricane, according to the U.K. Met Office . A similar vortex also encircles Antarctica during the southern winter.
Polar vortices occasionally reverse temporarily. These events can last for days, weeks or months and are caused by sudden stratospheric warming (SSW), when the temperatures in the stratosphere climb by as much as 90 degrees Fahrenheit (50 degrees Celsius) in the space of a couple of days, according to the Met Office .
Related: 'One of the biggest on record': Ozone hole bigger than North America opens above Antarctica

The sudden warming is caused by " planetary waves " in the atmosphere — compression waves formed when air rises into a region of different density and is pushed back downward by the force of Earth's spin. This process disrupts or reverses the vortex flow.
Sign up for the Live Science daily newsletter now
Get the world’s most fascinating discoveries delivered straight to your inbox.
The current reversal event in the Arctic began on March 4. However, the winds are starting to slow down, hinting that the vortex will return to its normal trajectory soon, Spaceweather.com reported .
"It was a substantial reversal," Amy Butler , a climate scientist at the National Oceanic and Atmospheric Administration (NOAA) and author of NOAA's new polar vortex blog , told Spaceweather.com. The speed of the reversed winds puts the event in the top six on record, she added.
Disruptions to the polar vortex can impact weather in the U.S., such as in 2019 when a massive cold front descended across the Midwest . These extreme weather events occur when the polar vortex deforms the jet stream — an air current that surrounds the polar vortex — exposing lower latitudes to large blobs of icy Arctic air.
This month's disruption did not change the shape of the jet stream, so weather patterns are expected to remain largely unaffected, according to Spaceweather.com.
However, the change in air temperature around the Arctic has sucked up large amounts of ozone from lower latitudes, creating a temporary ozone spike — the opposite of an ozone hole. Currently, there is more ozone surrounding the Arctic than at this time during any other year on record, according to Spaceweather.com. However, this ozone spike will disappear after the polar vortex returns to normal
— Big blob of hot water in Pacific may be making El Niño act weirdly
— Deadly cyclone 'Freddy' may be the longest-lived and most energetic storm ever recorded
— 'Gigantic jet' that shot into space may be the most powerful lightning bolt ever detected
The current reversal is the second of its kind this year, following a smaller event in January that did cause a brief cold snap in some states, Butler wrote in NOAA's polar vortex blog.
Historical records show that SSW events are more likely to occur during El Niño or La Niña, the two contrasting phases of a natural cycle of planet-wide warming and cooling. During these phases, global weather systems become more unstable, which sets the stage for more frequent reversal events, Butler wrote in the NOAA blog.
We are currently in the midst of a major El Niño , which could make further reversals or disruptions more likely over the next year or so.

Harry is a U.K.-based senior staff writer at Live Science. He studied marine biology at the University of Exeter before training to become a journalist. He covers a wide range of topics including space exploration, planetary science, space weather, climate change, animal behavior, evolution and paleontology. His feature on the upcoming solar maximum was shortlisted in the "top scoop" category at the National Council for the Training of Journalists (NCTJ) Awards for Excellence in 2023.
'You certainly don't see this every day': Ultra-rare backward-spinning tornado formed over Oklahoma
Eerie, orange skies loom over Athens as dust storm engulfs southern Greece
Mesmerizing photo shows weird, scowling parasitic plant that looks like a owl
Most Popular
- 2 Space photo of the week: 'God's Hand' leaves astronomers scratching their heads
- 3 Massive study of 8,000 cats reveals which breeds live longest
- 4 Orcas have attacked and sunk another boat in Europe — and experts warn there could be more attacks soon
- 5 James Webb telescope detects 1-of-a-kind atmosphere around 'Hell Planet' in distant star system
- 2 Snake Island: The isle writhing with vipers where only Brazilian military and scientists are allowed
- 3 Newfound 'glitch' in Einstein's relativity could rewrite the rules of the universe, study suggests
- 4 Alien 'Dyson sphere' megastructures could surround at least 7 stars in our galaxy, new studies suggest
- 5 'More Neanderthal than human': How your health may depend on DNA from our long-lost ancestors
IMAGES
VIDEO
COMMENTS
Non-CO 2 climate impacts mean aviation accounts for around 4% of global warming to date. While aviation accounts for around 2.5% of global CO 2 emissions, its overall contribution to climate change is higher.. Along with emitting CO 2 from burning fuel, planes also affect the concentration of other atmospheric gases and pollutants. They generate a short-term increase but a long-term decrease ...
New study gives a figure. by Liz Kimbrough on 6 April 2022. Researchers calculated that aviation contributes around 4% to human-induced global warming, more than most countries do. When jet fuel ...
September 3, 2020. Download Cover Image. New research that provides the most comprehensive calculations of aviation's impact on the climate finds that global air travel and transport is responsible for 3.5 percent of all drivers of climate change from human activities. The study, published in the journal Atmospheric Environmen t, evaluated ...
Emissions from flying. Contrails. Greenhouse gas emissions (GHG) Register now. Globally, emissions from air travel account for only about 3% of the warming human activities are causing, but ...
Big data reveals true climate impact of worldwide air travel. ScienceDaily . Retrieved May 16, 2024 from www.sciencedaily.com / releases / 2024 / 04 / 240430131900.htm
Air travel accounts for about 4 percent of human-induced global warming, and the United Nations warns that airplane emissions are set to triple by 2050.Planes are becoming more efficient, but our ...
The researchers analyzed nearly 40 million flights around the world last year. "Airlines, for all intents and purposes, are becoming more fuel efficient. But we're seeing demand outstrip any ...
The team concludes that the warming effect of contrails will rise from 50 milliwatts per square metre of Earth's surface in 2006 to 160 mW/m 2 by 2050. In comparison, the warming due to CO2 from ...
Aviation is an important contributor to the global economy, satisfying society's mobility needs. It contributes to climate change through CO2 and non-CO2 effects, including contrail-cirrus and ...
Fossil fuels burned for global air travel and airport operations contribute to the carbon pollution that is warming the planet. In 2022, global air travel emitted more than 780 Mt CO2, accounting ...
However, the growing global alarm about the environmental impacts of aviation comes as air travel continues to rise. A record 31.6 million passengers are expected travel on US airlines this week ...
Experts say commercial air travel accounts for about 3 to 4 percent of total U.S. greenhouse gas emissions. And while planes become more efficient with each new model, growing demand for flights ...
In fact, while worldwide air travel has been on an upward trajectory since 1945, the trend greatly accelerated after 2010 — before being brought down to Earth, so to speak, by the COVID-19 pandemic.
Aviation emissions account for about 2.5% of global emissions but drive about 7.2% of global warming due to high-altitude atmospheric effects (Lee et al., 2018).If it were a country, the aviation ...
Aviation is responsible for 4% of the 1.2°C rise in the global mean temperature we have already experienced since the industrial revolution. Without action to reduce flights, the sector will ...
Aviation contributes about 2% of the world's global carbon emissions, according to the International Air Transport Association (IATA). It predicts passenger numbers will double to 8.2 billion in ...
A 2016 article in the journal Carbon & Climate Law Review offers a high-level overview: increased precipitation will lead to more frequent delays, extreme heat will damage runways and storm surge ...
The impact on the coronavirus disease pandemic on global air transport was unprecedented, with up to a 74% drop in global passenger numbers in 2020, a fall of 2.7 billion compared to 4.5 billion in 2019 . During this sharp decline in air travel, carbon dioxide emissions reduced by 5.4% in 2020.
1.Introduction. The United Nations defines climate change as a long-term shift in temperatures and weather patterns. As the global climate continues to experience considerable shifts and changes, there is a significant wide range of impacts on human health (IPCC., 2021).Climate change is more than merely a worldwide issue but is a major worry that is a great menace to human health and the most ...
It emits just under one billion tonnes of CO 2 each year — around 2.5% of total global emissions [we look at air travel's role in climate change in more detail in another article]. International shipping contributes a similar amount, at 10.6%. Rail travel and freight emit very little — only 1% of transport emissions.
Tackling global warming. The aviation industry has only recently begun to tackle the warming effect of flying, and this study is timely for quantifying that impact. The solutions discussed in this study, such as moving to alternative fuels, present a clear pathway to minimising warming but these will take time to implement.
Aviation contributions to climate change from non-CO2 emissions and their effects can be assessed more accurately with alternative metrics to the conventional Global Warming Potential, suggests an ...
Climate change can affect air quality, and certain air pollutants can affect climate change. For example, hot sunny days associated with a warming climate can increase ground-level ozone in some areas. 4 Ground-level ozone is also a greenhouse gas that contributes to climate change by trapping heat in the atmosphere. Read more about greenhouse gases and the climate effects of certain air ...
The 2.8 parts per million increase in carbon dioxide airborne levels from January 2023 to December, wasn't as high as the jumps were in 2014 and 2015, but they were larger than every other year since 1959, when precise records started. Carbon dioxide's average level for 2023 was 419.3 parts per million, up 50% from pre-industrial times.
But there is a downside cost: it was estimated that the travel and tourism industry's contribution to global GHG emissions was about 8% of the total from 2009 to 2013, based on study results ...
April 2024 saw an average surface air temperature of 15.03 degrees Celsius, or 59.05 degrees Fahrenheit, the report found. ... Why the warming effects of this El Niño event will linger for ...
The huge solar storm is keeping power grid and satellite operators on edge. NASA's Solar Dynamics Observatory captured this image of solar flares early Saturday afternoon. The National Oceanic and ...
Increases in global temperatures could cause associated increases in premature deaths related to worsened ozone and particle pollution. Health outcome predictions. By 2050, researchers predict that there could be an increase of 1,000 to 4,300 premature deaths annually in the United States due to the combined effects of ozone and particle pollution.
published 27 March 2024. Earlier this month, a sudden atmospheric warming event caused the Arctic's polar vortex to reverse its trajectory. The swirling ring of cold air is now spinning in the ...
CNN —. The extent of the devastation of floods that are ravaging southern Brazil have been laid bare in new and dramatic satellite images shared with CNN. At least 95 people have died in the ...