How-To Geek
How to turn on the develop menu in safari on mac.
The Develop menu lets you view page source in Safari on Mac.

Quick Links
How to enable the develop menu in safari on mac, how to view page source in safari on mac.
When you right-click on any web page in Safari on Mac, it doesn't reveal the Show Page Source and Inspect Element buttons. To see these, you need to enable the Develop menu---we'll show you how to do that.
Once you've enabled the Develop menu, right-clicking a blank space on any website will reveal the Inspect Element and Show Page Source buttons. These allow you to take a look at the source code of any website, which is useful for things like downloading images from websites and debugging code or finding out what it looks like behind any site (for website designers).
You can easily turn on the Develop menu in Safari by following a couple of steps. Open Safari on your Mac and click the "Safari" button in the menu bar.
Next, select "Preferences." Alternatively, you can use the keyboard shortcut Command+, (comma). This will also open up Safari preferences.
Go to the "Advanced" tab.
Check the box for "Show Develop Menu in Menu Bar."
Now the Develop menu will appear between Bookmarks and Window at the top.
Apart from being able to view the page source, this will allow you to access developer-focused features, such as disabling JavaScript on any website.
Once you've enabled the Develop menu, there are a couple of ways to view the page source in Safari.
Open any website in Safari and right-click the blank space on the page. Now, select "Show Page Source." You can also get to this menu by using the keyboard shortcut Option+Command+u.
If you're looking for images or other media elements from any web page, Safari makes it easy to find these. In the left-hand pane, you will see various folders such as Images, Fonts, etc. Click the "Images" folder to quickly find the photos that you need.
After selecting an image, you can view its details easily by opening up the details sidebar. The button to open this is located at the top-right of the console, just below the gear icon. You can also open this with the shortcut Option+Command+0.
Click "Resource" at the top of the details sidebar to view details, such as the size of the image and its full URL.
You can change the position of the page source console easily, too. There are two buttons at the top-left of this console, right next to the X button. Click the rectangle icon to move the console to a different side within the browser window.
If you'd like to open the page source console in a separate window, you can click the two-rectangles icon. This will detach the console and open it in a separate window.
To check out the code for any specific element on the page, you can right-click that element and select "Inspect Element." This will take you directly to the code for the element that you selected.
Whenever you're done looking at the code, click the X button to close the page source console and return to browsing on Safari. You can also check out how to view a website's page source in Google Chrome here.
Related: How to View the HTML Source in Google Chrome
Download Free
Google Chrome vs Safari: A Comprehensive Browser Comparison
It's free and super easy to set up
Introduction to Google Chrome and Safari
When it comes to web browsing options, there are a plethora of choices available to users. However, in the world of desktop browsing, two heavyweights typically dominate the conversation: Google Chrome and Safari. While both browsers are strong contenders, it can be challenging to determine which one is the best fit for your needs. In this article, we will thoroughly compare the features, user interface, and performance of Google Chrome and Safari to help you make an informed decision.
When it comes to web browsing, there are few names as well-known as Google Chrome and Safari. Both of these browsers have their own unique features and advantages that make them popular among users of all ages and backgrounds.
What is Google Chrome?
Google Chrome is a free, open-source web browser that was first launched in 2008. Developed by Google, Chrome quickly rose to prominence thanks to its highly customizable nature and smooth user experience.
One of the key features that sets Chrome apart from other browsers is its extensive library of extensions and add-ons. These tools allow users to customize the browser to their specific needs, adding everything from ad-blockers and password managers to productivity apps and more.
Another major advantage of Chrome is its speed. Thanks to its advanced rendering engine, Chrome is able to load web pages quickly and efficiently, even on slower internet connections. This makes it a popular choice among users who need to browse the web quickly and efficiently, without wasting time waiting for pages to load.
What is Safari?
Developed by Apple, Safari is the default web browser for all iOS and macOS devices. With its sleek design, speed, and powerful performance, Safari remains a popular choice among Apple users worldwide.
One of the biggest advantages of Safari is its integration with other Apple products. For example, Safari allows users to easily sync their bookmarks, history, and other data across all of their Apple devices, making it easy to pick up where they left off no matter which device they are using.
In addition to its seamless integration with other Apple products, Safari is also known for its speed and performance. Like Chrome, Safari uses an advanced rendering engine to load web pages quickly and efficiently, even on slower internet connections. This makes it a popular choice among users who need to browse the web quickly and efficiently, without wasting time waiting for pages to load.
Overall, both Google Chrome and Safari are excellent choices for web browsing, each with their own unique features and advantages. Whether you prefer the customization options of Chrome or the seamless integration of Safari, both of these browsers are sure to provide you with a smooth and enjoyable browsing experience.
User Interface and Design
Google chrome's interface.
One of the key selling points of Google Chrome is its user-friendly interface. Chrome’s interface is clean, straightforward, and customizable, making navigation hassle-free. The browser has a simple and intuitive tab management system, which allows users to easily switch between tabs or create new ones. Additionally, Chrome offers a sleek and modern design that is pleasing to the eye, with smooth animations and a minimalist layout.
Chrome’s interface is also highly customizable, with a range of themes and extensions available for download from the Chrome Web Store. Users can personalize their browsing experience by choosing a theme that matches their preferences, or by adding extensions that enhance their productivity, security, or entertainment.
Another notable feature of Chrome’s interface is its omnibox, a combination of the URL bar and search bar. The omnibox allows users to quickly search for information or navigate to a specific website, without having to open a new tab or window. Chrome also has a built-in password manager, which can save and autofill login credentials for websites.
Safari's Interface
Safari’s interface features a minimalist design, with a top bar containing a URL and search bar. It is functional and straightforward in its design, though some users may find it more limited in customization options when compared to Chrome. The browser has a clean and uncluttered layout, with a focus on content rather than interface elements.
Like Chrome, Safari has a tab management system that allows users to switch between tabs or create new ones. The browser also has a feature called Top Sites, which displays a grid of frequently visited websites for quick access. Safari’s Reading List feature allows users to save articles or web pages to read later, even when offline.
Safari’s interface also includes a range of built-in tools and features, such as the ability to take screenshots or record screencasts. The browser has a Reader mode, which removes ads and other distractions from web pages for a more immersive reading experience. Safari also has a Private Browsing mode, which prevents the browser from saving browsing history, cookies, or other data.
In conclusion, both Google Chrome and Safari offer user-friendly interfaces that prioritize ease of use and accessibility. While Chrome may have more customization options and a more modern design, Safari’s minimalist layout and built-in features make it a solid choice for users who value simplicity and functionality.
Performance and Speed
When it comes to browsing the internet, performance and speed are two of the most important factors to consider. In this day and age, we want our web pages to load quickly and our browsers to be responsive.
Google Chrome's Performance
Google Chrome is known for its fast browsing speeds. Its performance capabilities are unparalleled, thanks to its advanced JavaScript engine. This engine allows for lightning-fast page rendering, making browsing a breeze. Additionally, Chrome can handle multiple tabs without lagging or crashing, making it a reliable choice for heavy internet users.
But Chrome's performance doesn't stop there. It also boasts a powerful set of developer tools that allow developers to test and optimize their websites for maximum speed and performance. These tools include a JavaScript debugger, a network panel, and a timeline view, among others.
Safari's Performance
Safari's performance, too, is generally regarded as impressive. Its speedy loading times and quick navigation make it a favorite choice among Apple users. Safari's rendering engine, WebKit, is known for its efficiency and speed, making browsing a smooth experience.
Like Chrome, Safari can handle multiple tabs without slowing down, making it a great choice for users who like to have multiple tabs open at once. Additionally, Safari has a set of developer tools that allow developers to test and optimize their websites for maximum performance. These tools include a JavaScript debugger, a timeline view, and a network panel, among others.
In conclusion, both Google Chrome and Safari are excellent choices when it comes to performance and speed. They both offer powerful rendering engines, efficient JavaScript engines, and reliable tab management. Whether you're a heavy internet user or a developer looking to optimize your website, both browsers have the tools and capabilities you need to get the job done.
Security and Privacy Features
Security features in google chrome.
Security is a top priority for Google, and so Google Chrome has several built-in features aimed at preventing malware and other online threats. Chrome offers an integrated sandbox environment that isolates web pages from other systems, making it more difficult for hackers to gain access to sensitive information. It also has an auto-updating feature that ensures it is always up-to-date with the latest security patches.
Security Features in Safari
Similar to Chrome, Safari features several security measures to protect user data. Safari utilizes advanced anti-phishing technologies to protect against fraudulent websites and an intelligent tracking prevention system that limits advertisers' ability to track user behavior. Additionally, Safari incorporates Apple's Keychain password management tool, which securely stores user login details.
Extensions and Add-ons
Google chrome's extension library.
Google Chrome is one of the most popular web browsers and offers an enormous selection of extensions, themes, apps, and add-ons that users can choose from. These extensions can be found on the Chrome Web Store and can be easily downloaded and installed with just a few clicks. The Chrome Web Store offers a wide variety of extensions, ranging from productivity tools to ad-blockers to entertainment add-ons.
One of the benefits of using Chrome is the ability to customize the browser to fit individual needs. With so many extensions available, users can enhance their browsing experience and tailor it to their specific interests. Additionally, due to its popularity, many developers prioritize developing extensions for Chrome first, meaning that users can often find the latest and most innovative add-ons on this platform.
Some of the most popular Chrome extensions include Grammarly, a spell-checking and grammar tool, LastPass, a password manager, and Adblock Plus, an ad-blocking extension. However, with so many options available, users can find extensions that cater to their unique needs and interests.
Safari's Extension Library
Safari is the default web browser for Apple devices and offers a smaller selection of extensions compared to Chrome. However, Safari's extension library still offers several useful plugins and extensions that can enhance the browsing experience.
Safari's extensions can be downloaded from the App Store, making it streamlined to download and manage new additions. This makes it easy for users to find and install new extensions without having to navigate to a separate website or store.
One of the benefits of using Safari is that it is optimized for Apple devices, meaning that Safari extensions are designed to work seamlessly with the hardware and software of Apple products. Additionally, Safari's extensions tend to be more curated and vetted, ensuring that users can trust the quality and security of the extensions they download.
Some of the most popular Safari extensions include Pocket, a bookmarking and read-later tool, 1Password, a password manager, and Ghostery Lite, an ad and tracker blocker. While Safari's extension library may not have as many user-made extensions and add-ons as Chrome, it still offers several useful tools that can enhance the browsing experience for Apple users.
Cross-Platform Compatibility
When it comes to choosing a web browser, cross-platform compatibility is a crucial factor to consider. It allows you to access your bookmarks, history, and preferences across multiple devices and platforms.
Google Chrome is one of the most widely used web browsers, and one of its significant advantages is its cross-platform compatibility. Whether you're using a Windows PC, a macOS laptop, or a Linux machine, you can easily download and use Google Chrome without any compatibility issues.
Moreover, Google Chrome's compatibility extends beyond desktop and laptop computers. You can also use it on some mobile devices, including Android smartphones and tablets. This feature makes it an excellent option for those who work on the go or use multiple devices regularly.
Google Chrome's User Interface
Aside from its cross-platform compatibility, Google Chrome is also known for its user-friendly interface. Its minimalist design and intuitive layout make it easy to use, even for those who are not tech-savvy.
Google Chrome also offers a wide range of customization options, allowing you to personalize your browsing experience. You can choose from various themes, extensions, and add-ons to enhance your productivity and make your browsing experience more enjoyable.
Safari's Compatibility
While Safari is primarily designed for Apple's devices, it can also be downloaded and used on Windows. However, its compatibility is limited, and its performance and features may differ significantly from its Apple counterparts.
One of the advantages of using Safari on an Apple device is its seamless integration with Apple's software and systems. For example, if you're using Safari on a MacBook, you can easily use features like Handoff and Continuity to switch between your MacBook and iPhone or iPad.
However, if you're using Safari on a Windows PC, you may experience some compatibility issues. Some websites and web applications may not work correctly, and you may encounter performance issues.
In conclusion, when it comes to cross-platform compatibility, Google Chrome is the clear winner. Its compatibility with a wide range of devices and systems makes it an excellent option for those who work across multiple platforms. However, if you're using an Apple device, Safari's seamless integration with Apple's software and systems may make it a better option for you.
Mobile Browsing Experience
Mobile browsing has become an essential part of our daily lives, and with the increase in the use of smartphones and tablets, it has become crucial to have a browser that provides a seamless and user-friendly experience on mobile devices. In this article, we will discuss two of the most popular browsers for mobile devices, Google Chrome, and Safari.
Google Chrome on Mobile Devices
Google Chrome is one of the most widely used browsers on desktops, and its mobile version is no different. It is available on both iOS and Android devices, and its mobile version offers many of the features found in its desktop counterpart, such as tab syncing, incognito mode, and voice search. Additionally, it is optimized for mobile use, making it an excellent option for those who browse frequently on their mobile devices.
One of the standout features of Google Chrome on mobile devices is its ability to sync tabs across devices. This means that you can start browsing on your desktop and continue on your mobile device without any interruption. This feature is especially useful if you are in the middle of reading an article or watching a video and need to switch devices.
Another feature that sets Google Chrome apart on mobile devices is its incognito mode. This mode allows you to browse the internet without leaving any trace of your browsing history, cookies, or search history. This is especially useful if you are using a shared device or browsing sensitive information.
Google Chrome on mobile devices also offers voice search, which allows you to search the internet by speaking into your device. This feature is particularly useful when you are on the go and need to search for something quickly without typing.
Safari on Mobile Devices
Safari is the default browser on all iOS devices, and it offers a seamless browsing experience on mobile thanks to its integration with Apple's software and systems. It has features like tab syncing, reader mode, and in-built privacy controls to make browsing on mobile devices smooth and user-friendly.
One of the standout features of Safari on mobile devices is its integration with Apple's software and systems. This means that if you are using an iPhone or iPad, you can seamlessly switch between your device and your Mac without any interruption. This feature is especially useful if you need to access a website or a document on your Mac while you are on the go.
Safari on mobile devices also offers a reader mode, which allows you to read articles without any distractions. This mode removes all ads, sidebars, and other distractions, making it easier to focus on the content. Additionally, Safari on mobile devices has in-built privacy controls, which allow you to browse the internet without leaving any trace of your browsing history, cookies, or search history.
In conclusion, both Google Chrome and Safari offer excellent browsing experiences on mobile devices. While Google Chrome is more widely used and offers features like voice search and incognito mode, Safari's integration with Apple's software and systems and its reader mode make it an excellent option for those who use iOS devices. Ultimately, the choice between the two will depend on your personal preferences and needs.
Developer Tools and Support
Developer tools in google chrome.
As an open-source browser, Google encourages developers to customize Chrome through extensions and plugins. It also offers comprehensive developer tools that make troubleshooting web applications easier. Chrome features the JavaScript console, source viewer, and error console, making it an ideal choice for developers.
Developer Tools in Safari
Developers using Safari can access advanced debugging, profiling, and testing features that make their work easier. Safari’s developer tools include features like the console, network inspector, and timeline tools to help pinpoint and troubleshoot issues on web pages. Additionally, Safari supports WebKit, a powerful layout engine used to create web pages and apps.
Conclusion: Which Browser is Right for You?
Ultimately, the choice between Google Chrome and Safari comes down to personal preference and specific needs. Both browsers offer rich features, speed, and security, and ultimately, the decision between them comes down to which one feels more comfortable to use. To decide, you can weigh the pros and cons exhibited in this article and focus on what matters most to you. Whichever browser you decide to use, be confident in the knowledge that you are using two of the most advanced and polished browsers available on the market today.
Let's set you up !
Working on the web!
Student Tips
Startup Tools
Browser Glossary
Browser Tips
Safari Developer Tools: The Complete Guide for Web Developers
Introduction to safari developer tools.
Safari is one of the major web browsers along with Chrome, Firefox, and Edge. As an Apple product, it comes pre-installed on Macs and iOS devices. Over the years, Safari has evolved to include robust developer tools accessible from the Develop menu. These built-in tools provide web developers with capabilities for debugging JavaScript, inspecting CSS, monitoring network requests, analyzing performance, auditing accessibility, and more.
Safari's developer tools are especially useful for testing and debugging web apps specifically within the Safari browser on macOS and iOS. They allow you to inspect cross-browser compatibility issues that may arise during development.
In this comprehensive guide, we'll explore the key features of Safari's developer tools and how to use them for front-end web development. Whether you are just getting started or looking to optimize your debugging workflow, you'll find tips and examples to help improve your process. Let's take a high-level look at what we'll cover:
- Using the JavaScript debugger to set breakpoints, inspect scope and objects, profile code performance, and log errors/warnings
- Inspecting and modifying CSS styles applied to page elements in real-time
- Monitoring network requests and analyzing load performance with Waterfall charts
- Throttling CPU and network to simulate mobile devices and slow connections
- Auditing for accessibility issues like color contrast, focus order, ARIA roles
- Testing responsive design across multiple device sizes and orientations
- Integrating with Xcode tools for advanced Swift/Obj-C debugging
- Additional tips like saving element inspection settings, keyboard shortcuts, and more
By the end, you'll have a solid understanding of how to leverage Safari developer tools in your web projects and debug more efficiently. Let's get started!
Debugging JavaScript with Safari Developer Tools
The JavaScript debugger is one of the most powerful features of Safari dev tools. It allows you to pause code execution at any point and step through your JavaScript line-by-line.
To start debugging, open the Sources tab and set breakpoints by clicking line numbers in your scripts. As you interact with your page, execution will pause when a breakpoint is hit. You can then step over, step into, or step out of functions and examine the current state.
For example, you can use the debugger to identify exactly where a promise-based function is failing by stepping through the promise callbacks line-by-line until you encounter the error.
In the Scope pane, you can inspect variable values in the current closure or parent scopes. The Call Stack shows the sequence of function calls. Object properties can be expanded in the Scope pane for detailed analysis.
The JavaScript debugger is especially useful for debugging asynchronous code like promises, timers, and events. Set breakpoints within callbacks to pause execution at the right moment.
The Console allows you to log messages like values, errors, warnings, and custom output. Use console.log() strategically throughout your code to understand control flow. The Console also displays runtime errors and exceptions to identify bugs.
For performance profiling, the Timelines tab provides JavaScript profiling. It visualizes script activity over time to identify slow functions. This helps pinpoint optimization opportunities.
Inspecting and Editing CSS
Safari dev tools make CSS debugging painless. The Elements tab lists all styles applied to the selected element, including information like specificity and inheritance.
The Styles pane displays media query breakpoints allowing you to view the cascade and specificity at different viewport sizes. This helps debug responsive layout issues.
You can edit CSS rules live in the Styles pane and instantly see the changes reflected on the page without having to save and refresh. This rapid feedback loop allows quick iteration on styling issues.
The magnifying glass tool lets you visually inspect padding, margins, and other box model properties overlaid on the page. This helps debug complex layouts and positioning issues.
To test state changes, you can force elements into states like :hover , :focus , and :active from the Styles pane. This allows you to debug styles applied on interaction without needing to actually interact with the element.
The Coverage tab identifies unused CSS rules that can safely be removed to optimize page load size. It also shows which rules have the greatest impact on render performance.
Debugging Network Requests and Performance
Safari developer tools provide rich insights into network requests, page load performance, and optimization opportunities.
The Network tab logs all requests sent by the page along with details like HTTP headers, response bodies, times, and more. Requests are color coded by type and can be searched and filtered.
Waterfall charts visualize resource loading over time, making it easy to spot assets that delay page render. Performance metrics like First Meaningful Paint help quantify user experience.
To simulate slow network connections, you can throttle CPU or bandwidth. This allows you to debug on 3G, or even EDGE mobile connections right from your desktop.
Auditing for Accessibility
The Audit tab in Safari dev tools scans your page for common accessibility issues and standards compliance.
It checks for insufficient color contrast, missing ARIA roles and attributes, invalid HTML, and more. Each issue links to detailed references to help fix it.
You can also manually inspect if elements have logical focus order, are navigable via keyboard, and meet other requirements. The Accessibility Tree view outlines the semantic structure.
Safari's built-in Reader mode provides a quick way to experience your site through a screen reader. It strips away formatting and extra elements, allowing you to focus on content structure.
Running regular audits during development prevents major accessibility regressions down the road and ensures your site meets guidelines like WCAG 2.1 AA.
Simulating Mobile Devices with Responsive Design Mode
Responsive web design requires continuously testing across viewport sizes. Safari dev tools make this easy with Responsive Design Mode.
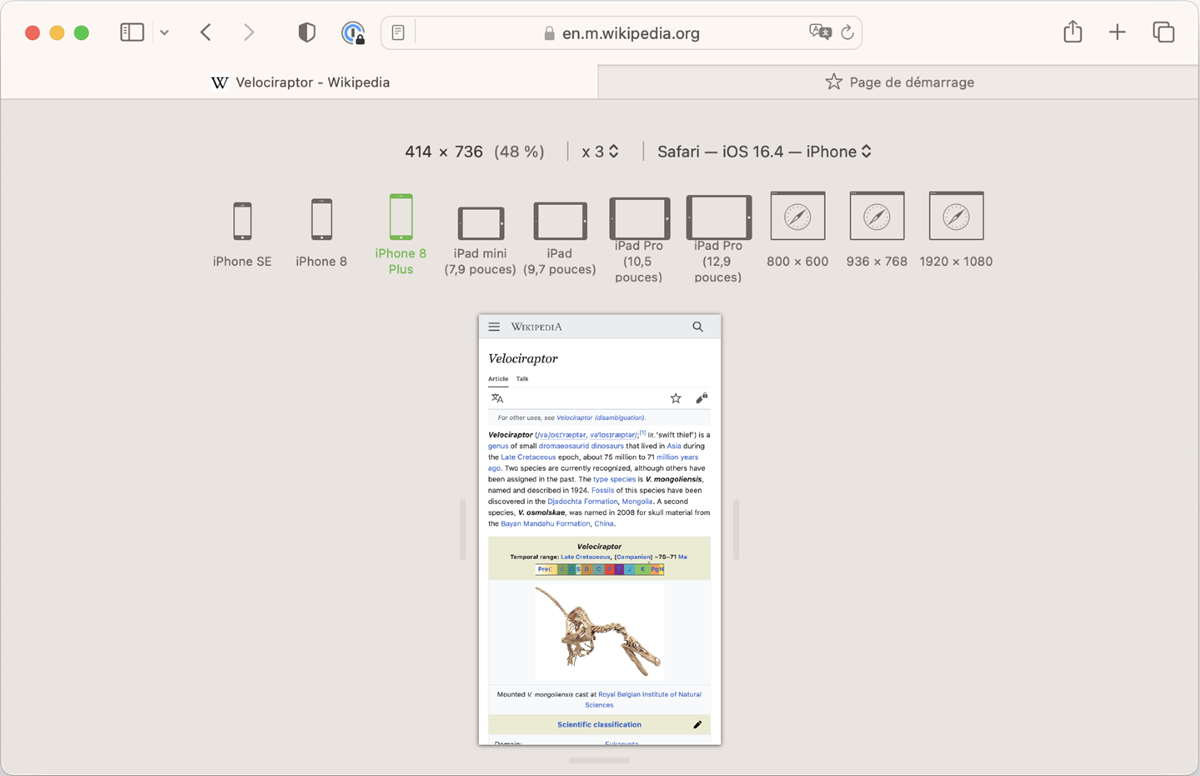
You can select preset device dimensions like iPhone, iPad, and desktop or enter custom sizes. Safari will resize to match those dimensions so you can view your responsive layouts.
For mobile testing, you can simulate touch events like pinch/zoom and swipe scrolling. This reveals any issues with touch targets or scroll performance.
Responsive Design Mode also allows flipping between portrait and landscape orientations. Test how your UI adapts to both modes during mobile use cases.
To access experimental features, enable the Safari Technology Preview for additional device simulation capabilities like user agent spoofing. This allows you to test in even more specific mobile scenarios.
Matching real device sizes while building responsive features ensures they'll work correctly across the vast device ecosystem. No more guessing at breakpoints!
Additional Tips and Tricks
Safari developer tools contain many handy power user features beyond the basics. Here are some tips to level up your skills:
- You can save and reapply custom element selection settings like force states, orientation, and device frames.
- Changes made in the Console and Sources tabs persist on reload so you can iteratively debug.
- The dev tools window can be docked to the bottom of the Safari window for more vertical space.
- Open multiple instances of dev tools to compare different pages side-by-side.
- Learn keyboard shortcuts for common debugging actions like pause, step over, log, etc.
- Enable the experimental features tab for tools like WebGL profiler, layer borders, and more.
Debugging Safari Extensions
If you build Safari extensions, enable extension debugging in Preferences > Advanced to load them unpacked.
This allows inspecting extension files, storage, dev tools console, and inter-process communication. You can debug injected scripts, content scripts, cross-origin messages, and more.
Integration with Xcode Developer Tools
For native iOS apps with web views, Safari dev tools integrate tightly with Xcode.
You can connect them to share cookies, caches, and other state. Set Xcode breakpoints in Swift or Obj-C that pause JavaScript execution in Safari tools.
The Xcode CPU profiler helps find JavaScript bottlenecks. Memory debugging, Energy Impact, and other Xcode tools provide additional low-level details when debugging Safari web views in iOS simulators and on physical devices.
Conclusion and Key Takeaways
Safari developer tools provide a robust feature set optimized for front-end web development. Their tight integration and ease of use can boost productivity.
Key strengths include the precise JavaScript debugger, real-time CSS manipulation, detailed network and performance analysis, thorough accessibility auditing, and accurate mobile simulation.
Web developers should consider integrating Safari dev tools into their broader workflows, especially for projects targeting Apple devices. They excel at responsive design testing and debugging native iOS web views.
While Safari dev tools may not be as fully-featured as competitors, their focus on web fundamentals like JavaScript, CSS, performance, and accessibility makes them very capable for many use cases.
With the tips, guides, and examples covered in this post, you should feel empowered to debug websites efficiently using Safari's built-in developer tools. They can help track down bugs faster, optimize performance, and build high-quality responsive experiences.
If you build developer tools for iOS or macOS, be sure to test them thoroughly with Safari developer tools during the launch process. The comprehensive debugging capabilities can help identify and resolve issues specific to Apple devices and browser engines. Consider submitting your app to DevHunt to get discovered by the developer community.
Related posts
- Master Chrome DevTools for Next-Level Web Development
- Unlock Chrome's Power with These Dev Tools
- Safari Developer Tools Help Debug Websites and Apps
- Dev Tools on Chrome - Your Web Debugging Swiss Army Knife
- Patrick Brosset
- Sep 7, 2021
What’s New With DevTools: Cross-Browser Edition
- 18 min read
- Tools , Browsers , Debugging , Testing , DevTools
- Share on Twitter , LinkedIn
About The Author
Patrick Brosset is a product manager on the Edge Developer Experience team at Microsoft, and previously worked at Mozilla. He has about 20 years of experience … More about Patrick ↬
Email Newsletter
Weekly tips on front-end & UX . Trusted by 200,000+ folks.
Browser developer tools keep evolving, with new and improved features added all the time. It’s hard to keep track, especially when using more than one browser. With that much on offer, it is not surprising that we feel overwhelmed and use the features we already know instead of keeping up with what’s new.
It’s a shame though, as some of them can make us much more productive.
So, my goal with this article is to raise awareness on some of the newest features in Chrome, Microsoft Edge, Firefox and Safari. Hopefully, it will make you want to try them out, and maybe will help you get more comfortable next time you need to debug a browser-specific issue.
With that said, let’s jump right in.
Chrome DevTools
The Chrome DevTools team has been hard at work modernizing their (now 13 years old) codebase. They have been busy improving the build system, migrating to TypeScript, introducing new WebComponents, re-building their theme infrastructure, and way more. As a result, the tools are now easier to extend and change.
But on top of this less user-facing work, the team did ship a lot of features too. Let me go over a few of them here, related to CSS debugging.
Scroll-snapping
CSS scroll-snapping offers web developers a way to control the position at which a scrollable container stops scrolling. It’s a useful feature for, e.g., long lists of photos where you want the browser to position each photo neatly within its scrollable container automatically for you.
If you want to learn more about scroll-snapping, you can read this MDN documentation , and take a look at Adam Argyle’s demos here .
The key properties of scroll-snapping are:
- scroll-snap-type , which tells the browser the direction in which snapping happens, and how it happens;
- scroll-snap-align , which tells the browser where to snap.
Chrome DevTools introduced new features that help debug these key properties:
- if an element defines scroll-snapping by using scroll-snap-type , the Elements panel shows a badge next to it.
- the scroll container,
- the items that scroll within the container,
- the position where items are aligned (marked by a blue dot).
This overlay makes it easy to understand if and how things snap into place after scrolling around. This can be very useful when, e.g., your items don’t have a background and boundaries between them are hard to see.
While scroll snapping isn’t a new CSS feature, adoption is rather low ( less than 4% according to chromestatus.com ), and since the specification changed, not every browser supports it the same way.
I hope that this DevTools feature will make people want to play more with it and ultimately adopt it for their sites.
Container queries
If you have done any kind of web development in recent years, you have probably heard of container queries . It’s been one of the most requested CSS features for the longest time and has been a very complex problem for browser makers and spec writers to solve.
If you don’t know what container queries are, I would suggest going through Stephanie Eckles’ Primer On CSS Container Queries article first.
In a few words, they’re a way for developers to define the layout and style of elements depending on their container’s size. This ability is a huge advantage when creating reusable components since we can make them adapt to the place they are used in (rather than only adapt to the viewport size which media queries are good for).
Fortunately, things are moving in this space and Chromium now supports container queries and the Chrome DevTools team has started adding tooling that makes it easier to get started with them.
Container queries are not enabled by default in Chromium yet (to enable them, go to chrome://flags and search for “container queries”), and it may still take a little while for them to be. Furthermore, the DevTools work to debug them is still in its early days. But some early features have already landed.
- When selecting an element in DevTools that has styles coming from a @container at-rule, then this rule appears in the Styles sidebar of the Elements panel. This is similar to how media queries styles are presented in DevTools and will make it straightforward to know where a certain style is coming from.
As the above screenshot shows, the Styles sidebar displays 2 rules that apply to the current element. The bottom one applies to the .media element at all times and provides its default style. And the top one is nested in a @container (max-width:300px) container query that only takes effect when the container is narrower than 300px.
- On top of this, just above the @container at-rule, the Styles pane displays a link to the element that the rule resolves to, and hovering over it displays extra information about its size. This way you know exactly why the container query matched.
The Chrome DevTools team is actively working on this feature and you can expect much more in the future.
Chromium Collaboration
Before going into features that other browsers have, let’s talk about Chromium for a little bit. Chromium is an open-source project that Chrome, Edge, Brave, and other browsers are built upon. It means all these browsers have access to the features of Chromium.
Two of the most active contributors to this project are Google and Microsoft and, when it comes to DevTools, they collaborated on a few interesting features that I’d like to go over now.
CSS Layout Debugging Tools
A few years ago, Firefox innovated in this space and shipped the first-ever grid and flexbox inspectors. Chromium-based browsers now also make it possible for web developers to debug grid and flexbox easily.
This collaborative project involved engineers, product managers and designers from Microsoft and Google, working towards a shared goal (learn more about the project itself in my BlinkOn talk ).
Among other things, DevTools now has the following layout debugging features:
- Highlight multiple grid and flex layouts on the page, and customize if you want to see grid line names or numbers, grid areas, and so on.
- Flex and grid editors to visually play around with the various properties.
- Alignment icons in the CSS autocomplete make it easier to choose properties and values.
- Highlight on property hover to understand what parts of the page a property applies to.
You can read more information about this on Microsoft’s and Google’s documentation sites.
Localization
This was another collaborative project involving Microsoft and Google which, now, makes it possible for all Chromium-based DevTools to be translated in languages other than English.
Originally, there was never a plan to localize DevTools, which means that this was a huge effort. It involved going over the entire codebase and making UI strings localizable.
The result was worth it though. If English isn’t your first language and you’d feel more comfortable using DevTools in a different one, head over to the Settings ( F1 ) and find the language drop-down.
Here is a screenshot of what it looks like in Chrome DevTools:
And here is how Edge looks in Japanese:
Edge DevTools
Microsoft switched to Chromium to develop Edge more than 2 years ago now. While, at the time, it caused a lot of discussions in the web community, not much has been written or said about it since then. The people working on Edge (including its DevTools) have been busy though, and the browser has a lot of unique features now.
Being based on the Chromium open source project does mean that Edge benefits from all of its features and bug fixes. Practically speaking, the Edge team ingests the changes made in the Chromium repository in their own repository.
But over the past year or so, the team started to create Edge-specific functionality based on the needs of Edge users and feedback. Edge DevTools now has a series of unique features that I will go over.
Opening, Closing, and Moving Tools
With almost 30 different panels, DevTools is a really complicated piece of software in any browser. But, you never really need access to all the tools at the same time. In fact, when starting DevTools for the first time, only a few panels are visible and you can add more later.
On the other hand though, it’s hard to discover the panels that aren’t shown by default, even if they could be really useful to you.
Edge added 3 small, yet powerful, features to address this:
- a close button on tabs to close the tools you don’t need anymore,
- a + (plus) button at the end of the tab bar to open any tool,
- a context menu option to move tools around.
The following GIF shows how closing and opening tools in both the main and drawer areas can be done in Edge.
You can also move tools between the main area and drawer area:
- right-clicking on a tab at the top shows a “Move to bottom” item, and
- right-clicking on a tab in the drawer shows a “Move to top” item.
Getting Contextual Help with the DevTools Tooltips
It is hard for beginners and seasoned developers alike to know all about DevTools. As I mentioned before, there are so many panels that it’s unlikely you know them all.
To address this, Edge added a way to go directly from the tools to their documentation on Microsoft’s website .
This new Tooltips feature works as a toggleable overlay that covers the tools. When enabled, panels are highlighted and contextual help is provided for each of them, with links to documentation.
You can start the Tooltips in 3 different ways:
- by using the Ctrl + Shift + H keyboard shortcut on Windows/Linux ( Cmd + Shift + H on Mac);
- by going into the main ( ... ) menu, then going into Help, and selecting “Toggle the DevTools Tooltips”;
- by using the command menu and typing “Tooltips”.
Customizing Colors
In code editing environments, developers love customizing their color themes to make the code easier to read and more pleasant to look at. Because web developers spend considerable amounts of time in DevTools too, it makes sense for it to also have customizable colors.
Edge just added a number of new themes to DevTools , on top of the already available dark and light themes. A total of 9 new themes were added. These come from VS Code and will therefore be familiar to people using this editor.
You can select the theme you want to use by going into the settings (using F1 or the gear icon in the top-right corner), or by using the command menu and typing theme .

Firefox DevTools
Similar to the Chrome DevTools team, the folks working on Firefox DevTools have been busy with a big architecture refresh aimed at modernizing their codebase. Additionally, their team is quite a bit smaller these days as Mozilla had to refocus over recent times. But, even though this means they had less time for adding new features, they still managed to release a few really interesting ones that I’ll go over now.
Debugging Unwanted Scrollbars
Have you ever asked yourself: “where is this scrollbar coming from?” I know I have, and now Firefox has a tool to debug this very problem.
In the Inspector panel, all elements that scroll have a scroll badge next to them, which is already useful when dealing with deeply nested DOM trees. On top of this, you can click this badge to reveal the element (or elements) that caused the scrollbar to appear.
You can find more documentation about it here .
Visualizing Tabbing Order
Navigating a web page with the keyboard requires using the tab key to move through focusable elements one by one. The order in which focusable elements get focused while using tab is an important aspect of the accessibility of your site and an incorrect order may be confusing to users. It’s especially important to pay attention to this as modern layout CSS techniques allow web developers to rearrange elements on a page very easily.
Firefox has a useful Accessibility Inspector panel that provides information about the accessibility tree, finds and reports various accessibility problems automatically, and lets you simulate different color vision deficiencies.
On top of these features, the panel now provides a new page overlay that displays the tabbing order for focusable elements.
To enable it, use the “Show Tabbing Order” checkbox in the toolbar.
A Brand New Performance Tool
Not many web development areas depend on tooling as much as performance optimization does. In this domain, Chrome DevTools’ Performance panel is best in class.
Over the past few years, Firefox engineers have been focusing on improving the performance of the browser itself, and to help them do this, they built a performance profiler tool. The tool was originally built to optimize the engine native code but supported analyzing JavaScript performance right from the start, too.
Today, this new performance tool replaces the old Firefox DevTools performance panel in pre-release versions (Nightly and Developer Edition). Take it for a spin when you get the chance.
Among other things, the new Firefox profiler supports sharing profiles with others so they can help you improve the performance of your recorded use case.
You can read documentation about it here , and learn more about the project on their GitHub repository .
Safari Web Inspector
Last but not least, let’s go over a few of the recent Safari features.
The small team at Apple has been keeping itself very busy with a wide range of improvements and fixes around the tools. Learning more about the Safari Web Inspector can help you be more productive when debugging your sites on iOS or tvOS devices. Furthermore, it has a bunch of features that other DevTools don’t, and that not a lot of people know about.
CSS Grid Debugging
With Firefox, Chrome, and Edge (and all Chromium-based browsers) having dedicated tools for visualizing and debugging CSS grids, Safari was the last major browser not to have this. Well, now it does!
Fundamentally, Safari now has the same features just like other browsers’ DevTools in this area. This is great as it means it’s easy to go from one browser to the next and still be productive.
- Grid badges are displayed in the Elements panel to quickly find grids.
- Clicking on the badge toggles the visualization overlay on the page.
- A new Layout panel is now displayed in the sidebar. It allows you to configure the grid overlay, see the list of all grids on the page and toggle the overlay for them.
What’s interesting about Safari’s implementation though is that they’ve really nailed the performance aspect of the tool. You can enable many different overlays at once, and scroll around the page without it causing any performance problems at all.
The other interesting thing is Safari introduced a 3-pane Elements panel, just like Firefox, which allows you to see the DOM, the CSS rules for the selected element, and the Layout panel all at once.
Find out more about the CSS Grid Inspector on this WebKit blog post .
A Slew of Debugger Improvements
Safari used to have a separate Resources and Debugger panel. They have merged them into a single Sources panel that makes it easier to find everything you need when debugging your code. Additionally, this makes the tool more consistent with Chromium which a lot of people are used to.
Consistency for common tasks is important in a cross-browser world. Web developers already need to test across multiple browsers, so if they need to learn a whole new paradigm when using another browser’s DevTools, it can make things more difficult than they need to be.
But Safari also recently focused on adding innovative features to its debugger that other DevTools don’t have.
Bootstrap script : Safari lets you write JavaScript code that is guaranteed to run first before any of the scripts on the page. This is very useful to instrument built-in functions for adding debugger statements or logging for example.
New breakpoint configurations : All browsers support multiple types of breakpoints like conditional breakpoints, DOM breakpoints, event breakpoints, and more.
Safari recently improved their entire suite of breakpoint types by giving them all a way to configure them extensively. With this new breakpoint feature, you can decide:
- if you want a breakpoint to only hit when a certain condition is true,
- if you want the breakpoint to pause execution at all, or just execute some code,
- or even play an audio beep so you know some line of code was executed.
queryInstances and queryHolders console functions : These two functions are really useful when your site starts using a lot of JavaScript objects. In some situations, it may become difficult to keep track of the dependencies between these objects, and memory leaks may start to appear, too.
Safari does have a Memory tool that can help resolve these issues by letting you explore memory heap snapshots. But sometimes you already know which class or object is causing the problem and you want to find what instances exist or what refers to it.
If Animal is a JavaScript class in your application, then queryInstances(Animal) will return an array of all of its instances.
If foo is an object in your application, then queryHolders(foo) will return an array of all the other objects that have references to foo .
Closing Thoughts
I hope these features will be useful to you. I can only recommend using multiple browsers and getting familiar with their DevTools. Being more familiar with other DevTools can prove useful when you have to debug an issue in a browser you don’t use on a regular basis.
Know that the companies which make browsers all have teams working on DevTools actively. They’re invested in making them better, less buggy, and more powerful. These teams depend on your feedback to build the right things. Without hearing about what problems you are facing, or what features you lack, it’s harder for them to make the right decisions about what to build.
Reporting bugs to a DevTools team won’t just help you when the fix comes, but may also be helping many others who have been facing the same issue.
It’s worth knowing that the DevTools teams at Microsoft, Mozilla, Apple and Google are usually fairly small and receive a lot of feedback, so reporting an issue does not mean it will be fixed quickly, but it does help, and those teams are listening .
Here are a few ways you can report bugs, ask questions or request features:
- Firefox uses Bugzilla as their public bug tracker and anyone is welcome to report bugs or ask for new features by creating a new entry there. All you need is a GitHub account to log in.
- Getting in touch with the team can either be done on Twitter by using the @FirefoxDevTools account or logging in to the Mozilla chat (find documentation about the chat here ).
- Safari also uses public bug tracking for their WebKit bugs . Here is documentation about how to search for bugs and report new ones .
- You can also get in touch with the team on Twitter with @webkit .
- Finally, you can also signal bugs about Safari and the Safari Web Inspector using the feedback assistant .
- The easiest way to report a problem or ask for a feature is by using the feedback button in DevTools (the little stick figure in the top-right corner of the tools).
- Asking questions to the team works best over Twitter by mentioning the @EdgeDevTools account.
- The team listens for feedback on the devtools-dev mailing list as well as on twitter at @ChromeDevTools .
- Since Chromium is the open-source project that powers Google Chrome and Microsoft Edge (and others), you can also report issues on the Chromium’s bug tracker .
With that, thank you for reading!
Smashing Newsletter
Tips on front-end & UX, delivered weekly in your inbox. Just the things you can actually use.
Front-End & UX Workshops, Online
With practical takeaways, live sessions, video recordings and a friendly Q&A.
TypeScript in 50 Lessons
Everything TypeScript, with code walkthroughs and examples. And other printed books.
- Skip to main content
- Skip to search
- Skip to select language
- Sign up for free
- Português (do Brasil)
What are browser developer tools?
Every modern web browser includes a powerful suite of developer tools. These tools do a range of things, from inspecting currently-loaded HTML, CSS and JavaScript to showing which assets the page has requested and how long they took to load. This article explains how to use the basic functions of your browser's devtools.
Note: Before you run through the examples below, open the Beginner's example site that we built during the Getting started with the Web article series. You should have this open as you follow the steps below.
How to open the devtools in your browser
The devtools live inside your browser in a subwindow that looks roughly like this, depending on what browser you are using:
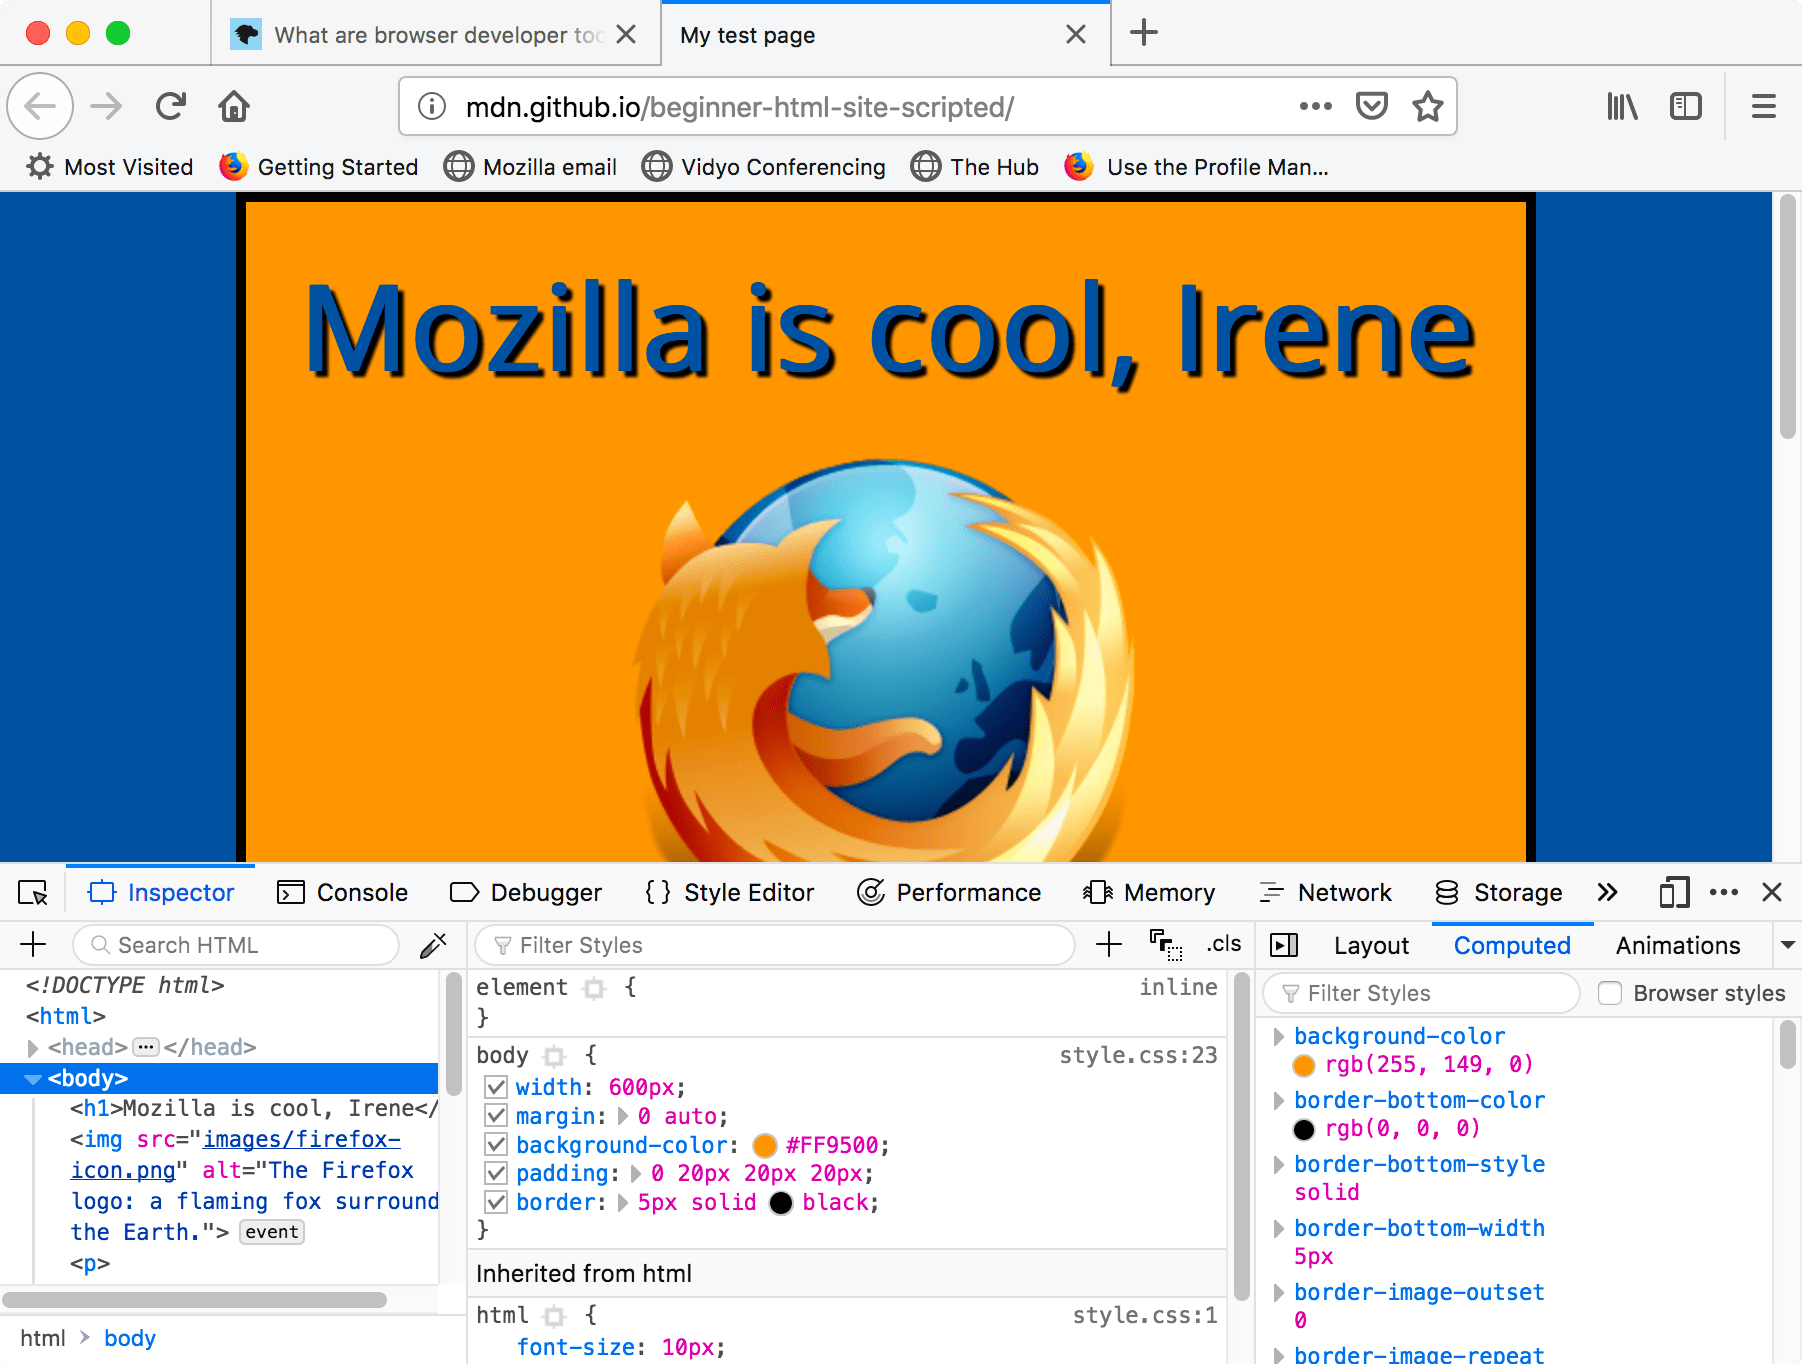
How do you pull it up? Three ways:
- Windows: Ctrl + Shift + I or F12
- macOS: ⌘ + ⌥ + I
- Chrome: More tools ➤ Developer tools
- Safari: Develop ➤ Show Web Inspector. If you can't see the Develop menu, go to Safari ➤ Preferences ➤ Advanced , and check the Show Develop menu in menu bar checkbox.
- Opera : Developer ➤ Developer tools
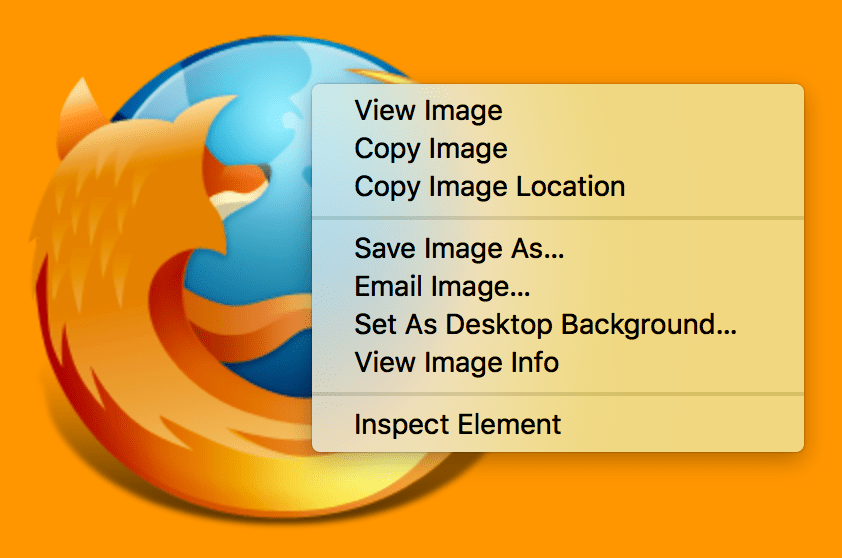
- Context menu: Press-and-hold/right-click an item on a webpage (Ctrl-click on the Mac), and choose Inspect Element from the context menu that appears. ( An added bonus: this method straight-away highlights the code of the element you right-clicked.)
The Inspector: DOM explorer and CSS editor
The developer tools usually open by default to the inspector, which looks something like the following screenshot. This tool shows what the HTML on your page looks like at runtime, as well as what CSS is applied to each element on the page. It also allows you to instantly modify the HTML and CSS and see the results of your changes reflected live in the browser viewport.
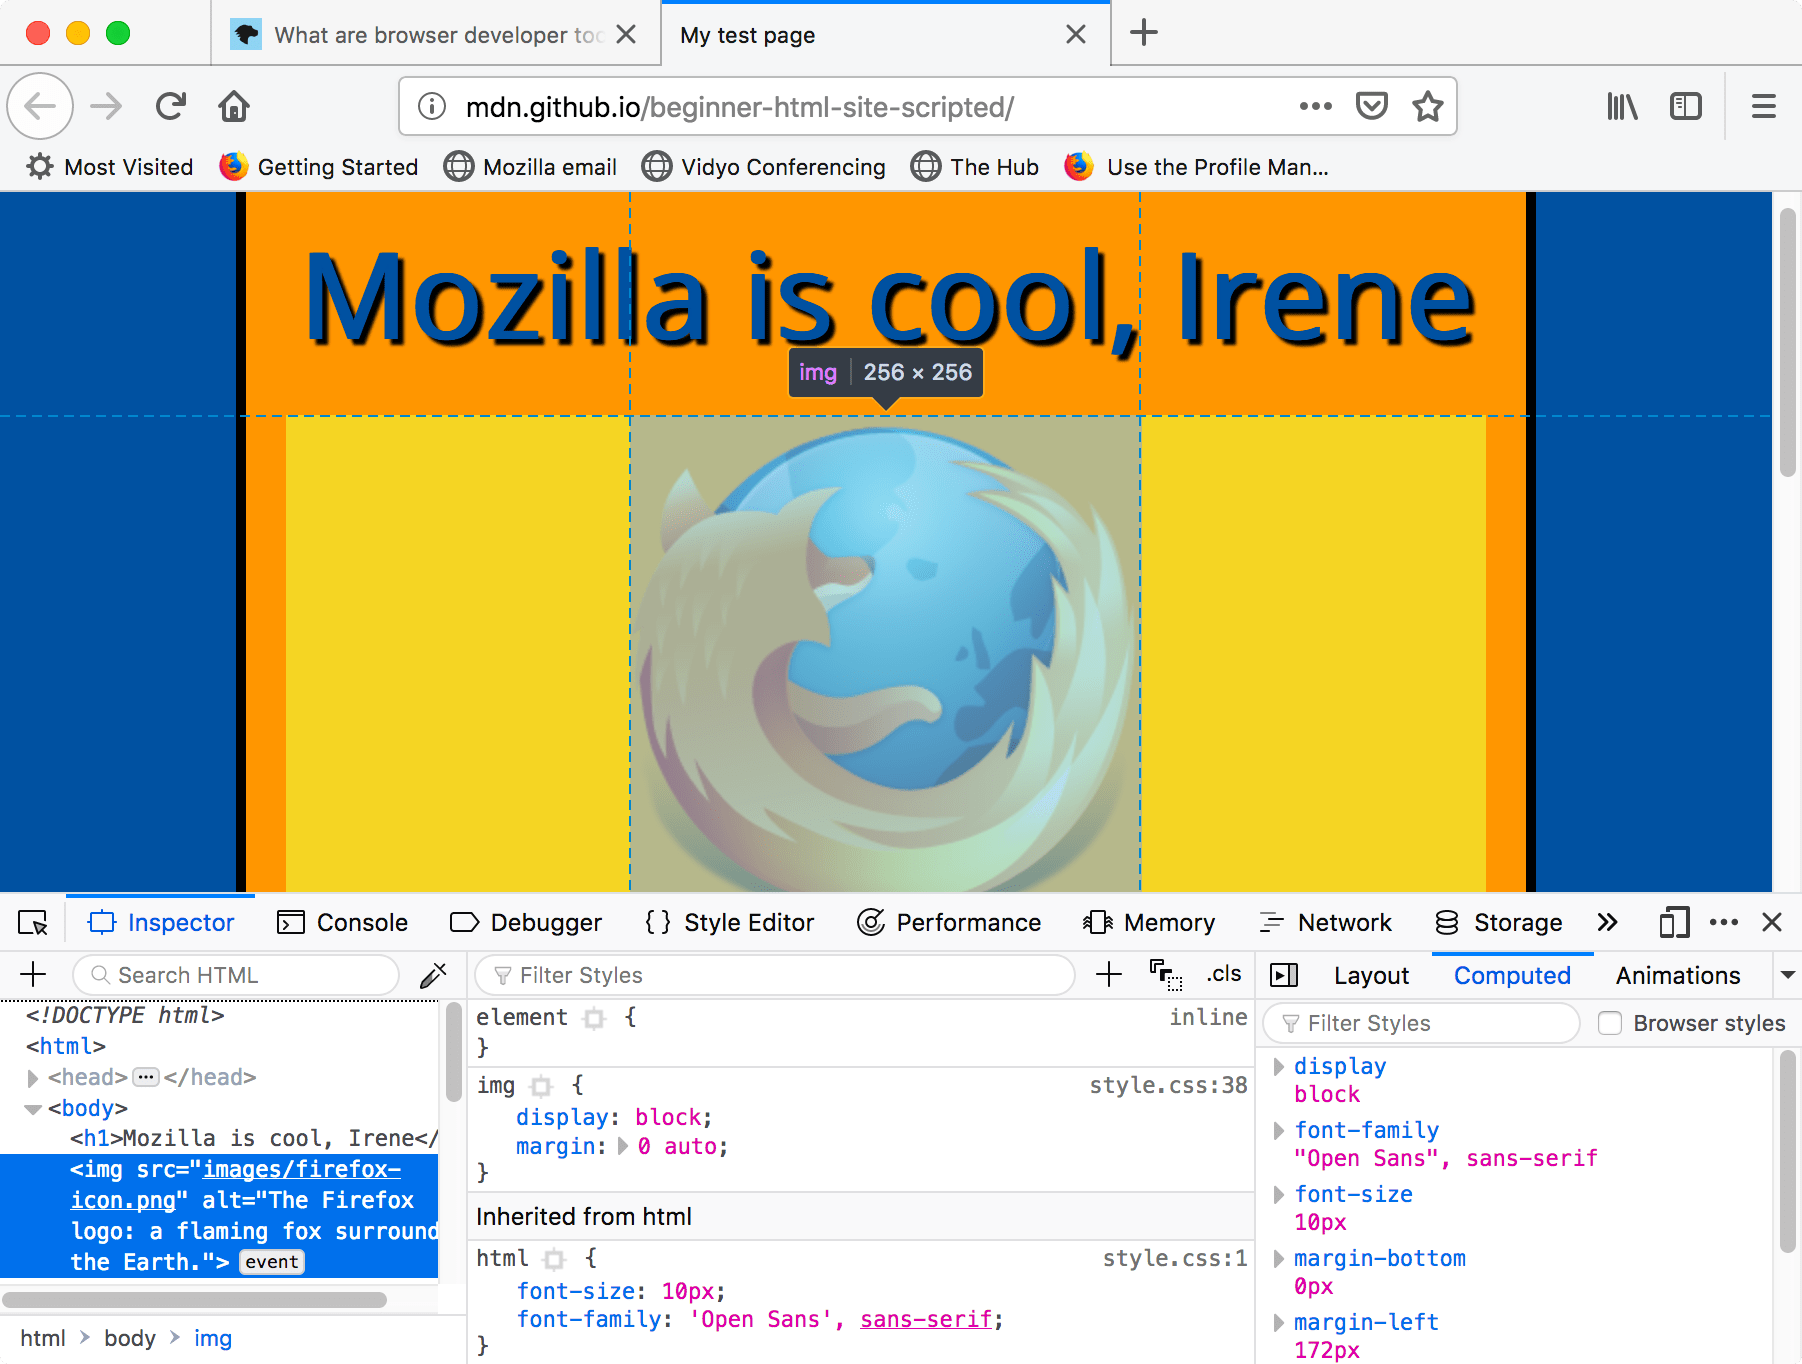
If you don't see the inspector,
- Tap/click the Inspector tab.
- In Chrome, Microsoft Edge, or Opera, tap/click Elements.
- In Safari, the controls are not so clearly presented, but you should see the HTML if you haven't selected something else to appear in the window. Press the Style button to see the CSS.
Exploring the DOM inspector
For a start, right-click (Ctrl-click) an HTML element in the DOM inspector and look at the context menu. The available menu options vary among browsers, but the important ones are mostly the same:
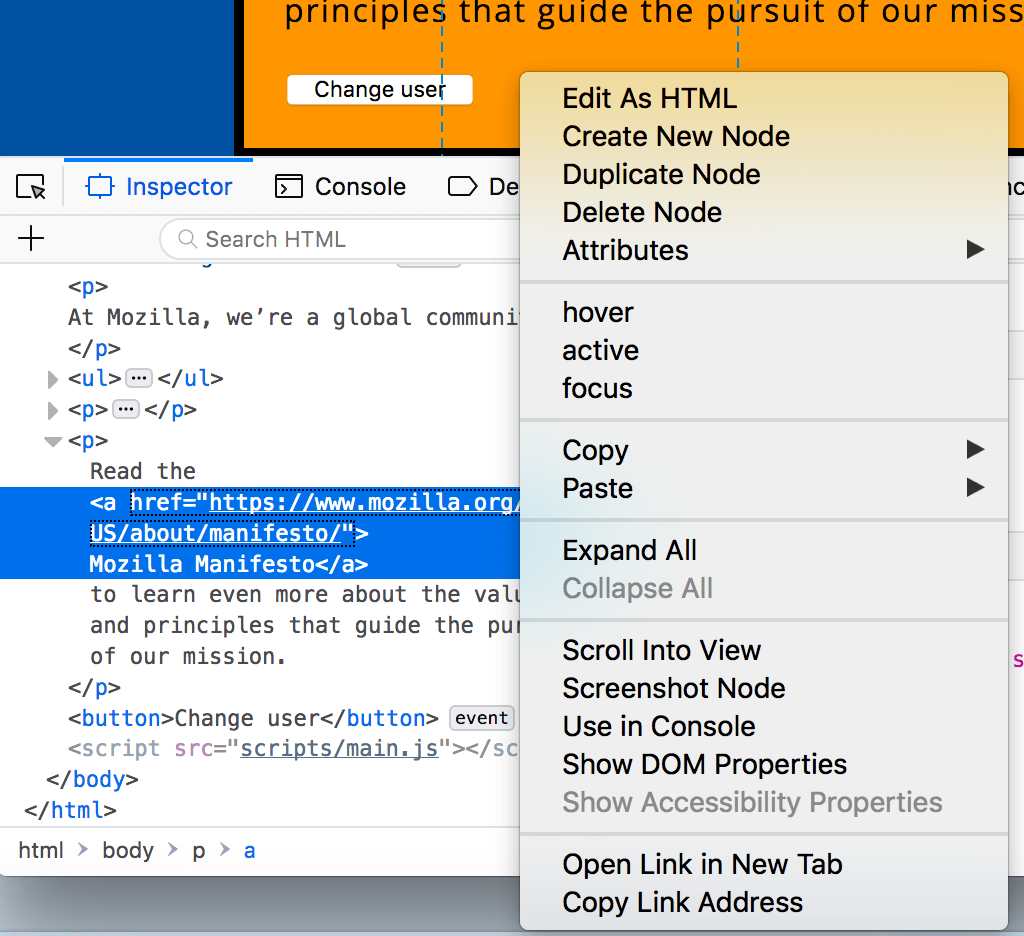
- Delete Node (sometimes Delete Element ). Deletes the current element.
- Edit as HTML (sometimes Add attribute / Edit text ). Lets you change the HTML and see the results on the fly. Very useful for debugging and testing.
- :hover/:active/:focus . Forces element states to be toggled on, so you can see what their styling would look like.
- Copy/Copy as HTML . Copy the currently selected HTML.
- Some browsers also have Copy CSS Path and Copy XPath available, to allow you to copy the CSS selector or XPath expression that would select the current HTML element.
Try editing some of your DOM now. Double-click an element, or right-click it and choose Edit as HTML from the context menu. You can make any changes you'd like, but you cannot save your changes.
Exploring the CSS editor
By default, the CSS editor displays the CSS rules applied to the currently selected element:
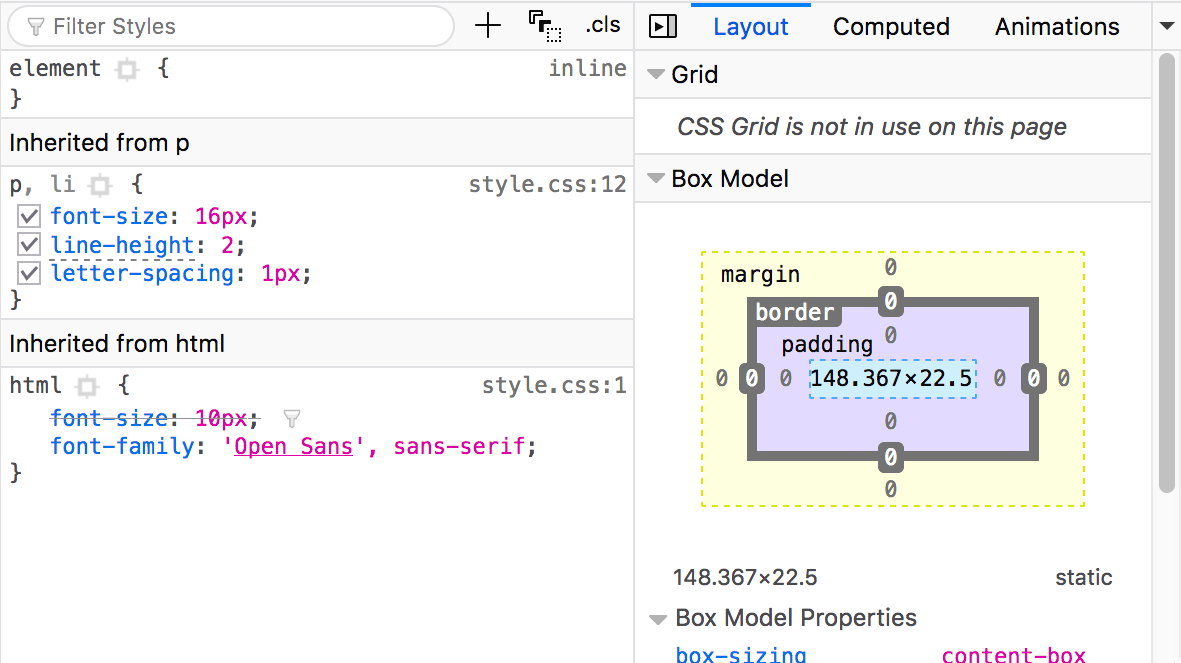
These features are especially handy:
- The rules applied to the current element are shown in order of most-to-least-specific.
- Click the checkboxes next to each declaration to see what would happen if you removed the declaration.
- Click the little arrow next to each shorthand property to show the property's longhand equivalents.
- Click a property name or value to bring up a text box, where you can key in a new value to get a live preview of a style change.
- Next to each rule is the file name and line number the rule is defined in. Clicking that rule causes the dev tools to jump to show it in its own view, where it can generally be edited and saved.
- You can also click the closing curly brace of any rule to bring up a text box on a new line, where you can write a completely new declaration for your page.
You'll notice a number of clickable tabs at the top of the CSS Viewer:
- Computed : This shows the computed styles for the currently selected element (the final, normalized values that the browser applies).
- Box Model : represents visually the current element's box model, so you can see at a glance what padding, border and margin is applied to it, and how big its content is.
- Grid : If the page you are inspecting uses CSS Grid, this section allows you to view the grid details.
- Fonts : In Firefox, the Fonts tab shows the fonts applied to the current element.
Find out more
Find out more about the Inspector in different browsers:
- Firefox Page inspector
- Chrome DOM inspector (Opera's inspector works the same as this)
- Safari DOM inspector and style explorer
The JavaScript debugger
The JavaScript debugger allows you to watch the value of variables and set breakpoints, places in your code that you want to pause execution and identify the problems that prevent your code from executing properly.
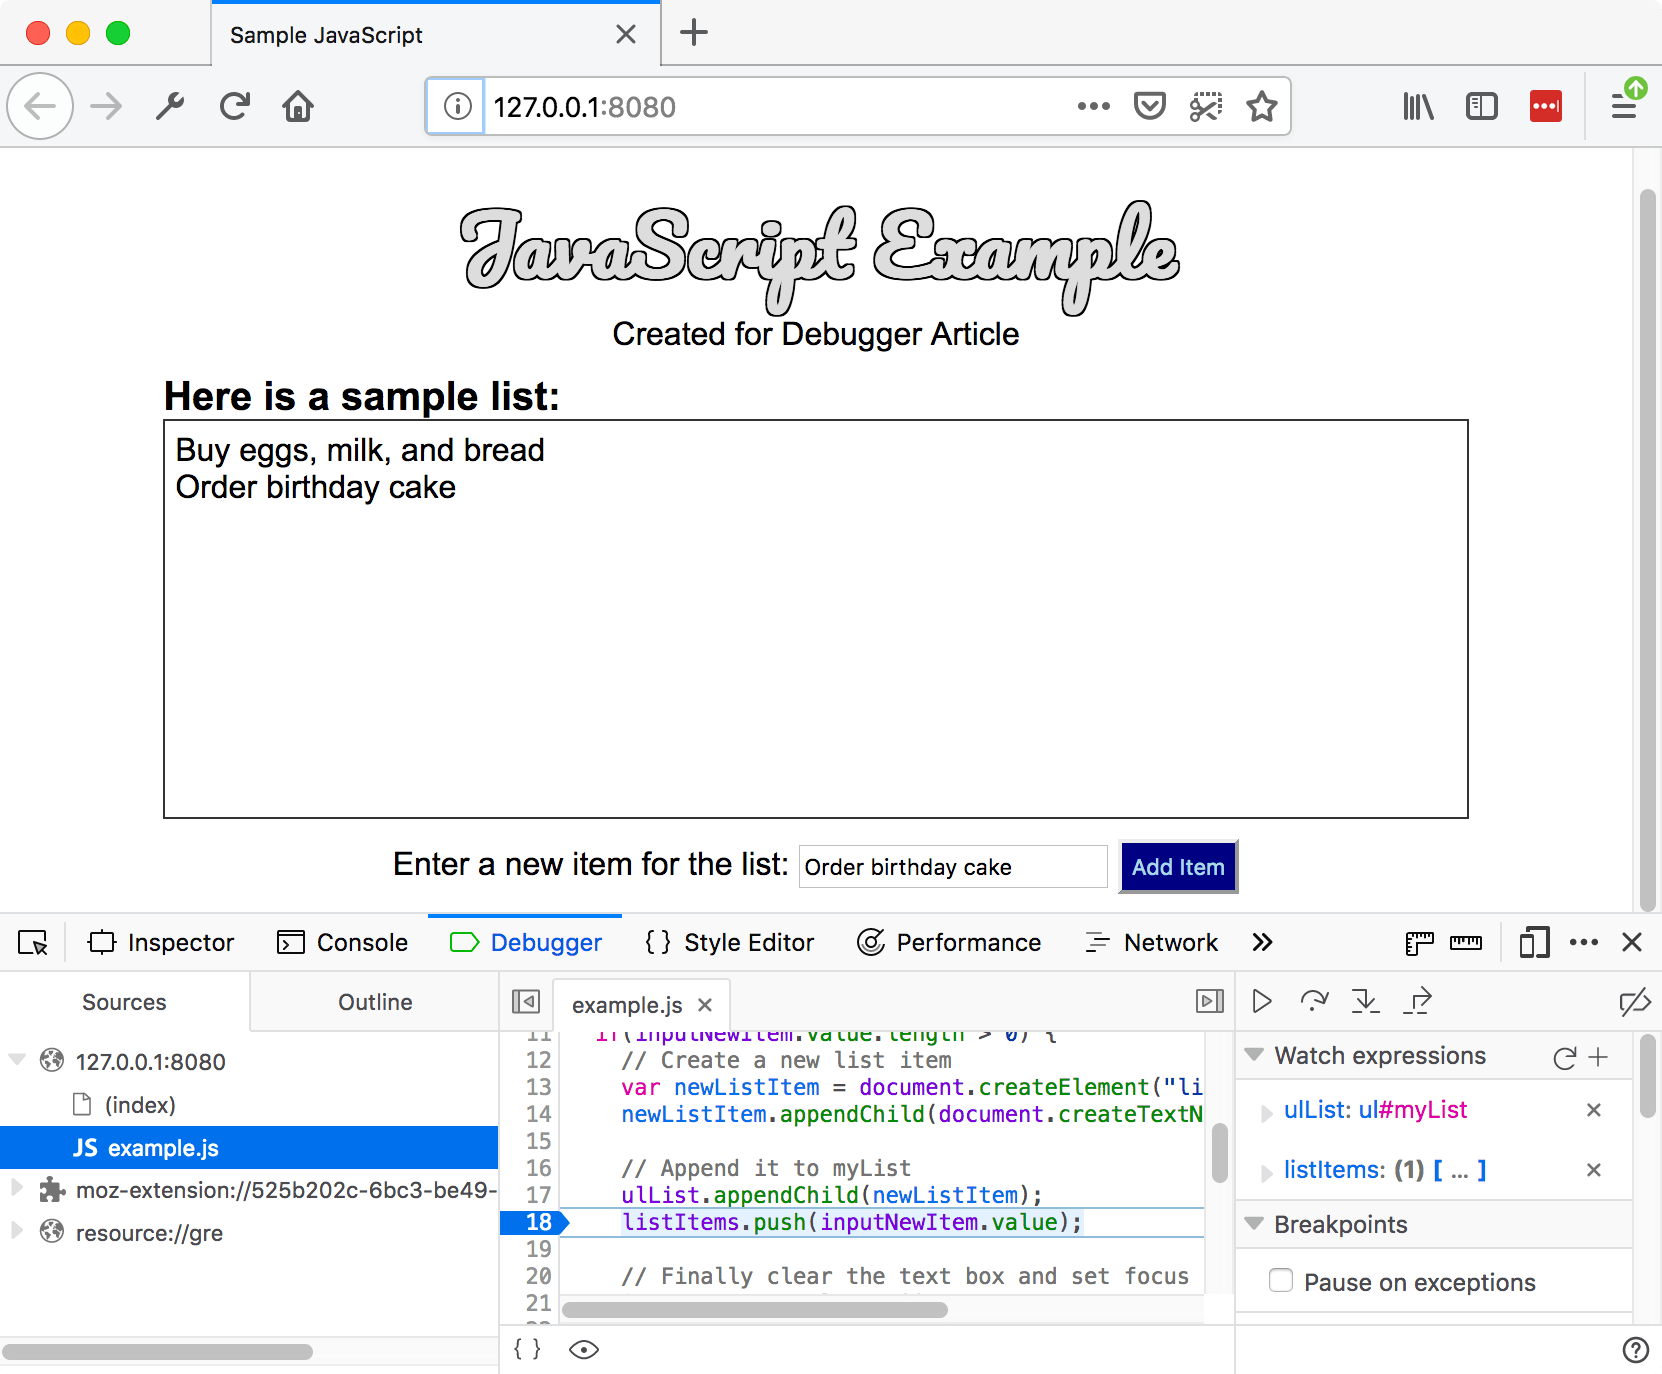
To get to the debugger:
Chrome : Open the Developer tools and then select the Sources tab. (Opera works the same way.)
Safari : Open the Developer Tools and then select the Debugger tab.
Exploring the debugger
There are three panes in the JavaScript Debugger on Firefox.
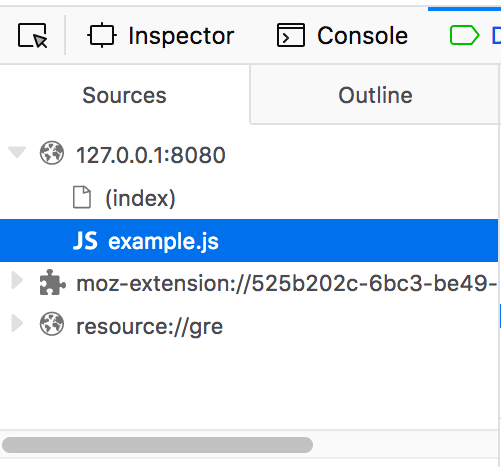
The first pane on the left contains the list of files associated with the page you are debugging. Select the file you want to work with from this list. Click on a file to select it and view its contents in the center pane of the Debugger.
Source code
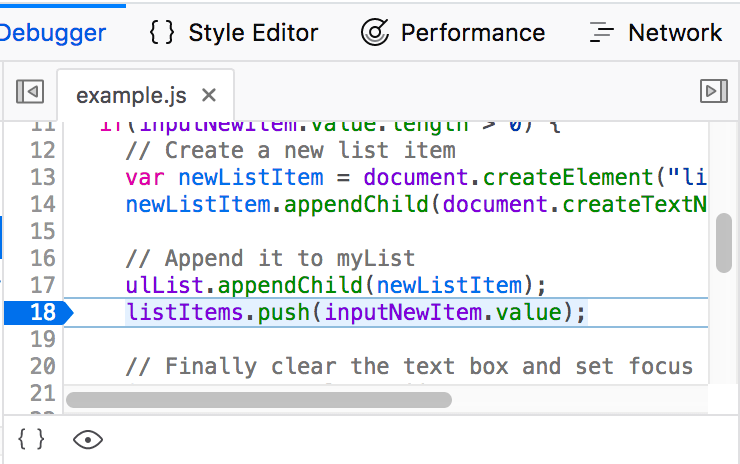
Set breakpoints where you want to pause execution. In the following image, the highlight on the number 18 shows that the line has a breakpoint set.
Watch expressions and breakpoints
The right-hand pane shows a list of the watch expressions you have added and breakpoints you have set.
In the image, the first section, Watch expressions , shows that the listItems variable has been added. You can expand the list to view the values in the array.
The next section, Breakpoints , lists the breakpoints set on the page. In example.js, a breakpoint has been set on the statement listItems.push(inputNewItem.value);
The final two sections only appear when the code is running.
The Call stack section shows you what code was executed to get to the current line. You can see that the code is in the function that handles a mouse click, and that the code is currently paused on the breakpoint.
The final section, Scopes , shows what values are visible from various points within your code. For example, in the image below, you can see the objects available to the code in the addItemClick function.
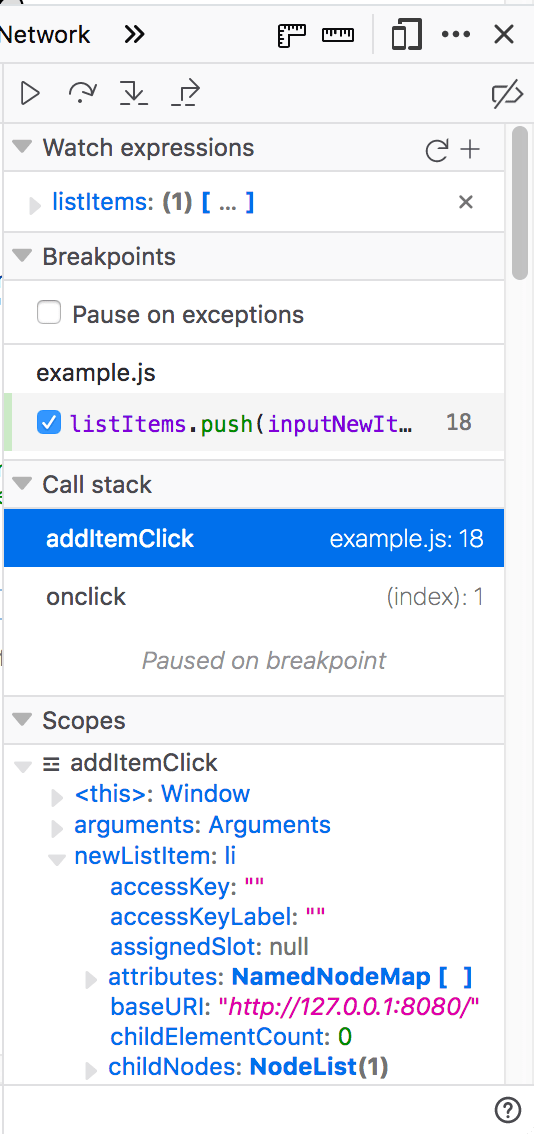
Find out more about the JavaScript debugger in different browsers:
- Firefox JavaScript Debugger )
- Microsoft Edge Debugger
- Chrome Debugger
- Safari Debugger
The JavaScript console
The JavaScript console is an incredibly useful tool for debugging JavaScript that isn't working as expected. It allows you to run lines of JavaScript against the page currently loaded in the browser, and reports the errors encountered as the browser tries to execute your code. To access the console in any browser:
If the developer tools are already open, click or press the Console tab.
This will give you a window like the following:

To see what happens, try entering the following snippets of code into the console one by one (and then pressing Enter):
Now try entering the following incorrect versions of the code and see what you get.
You'll start to see the kind of errors that the browser returns. Often these errors are fairly cryptic, but it should be pretty simple to figure these problems out!
Find out more about the JavaScript console in different browsers:
- Firefox Web Console
- Chrome JavaScript Console (Opera's inspector works the same as this)
- Safari Console
- Debugging HTML
- Debugging CSS

How to Use React DevTools in Safari
Published on Jun 09, 2023 in platforms by Lucien Chemaly 11 minute read
React is commonly used for the frontend in static site generators like Gatsby and now WordPress . React DevTools is a set of developer tools with a multitude of features that can make your workflow more efficient and help you debug and optimize your code.
However, if you use Safari, you may be disappointed to learn that there is no browser extension for React DevTools like there is in Chrome and Firefox.
Fortunately, there is a solution. You can still use standalone React DevTools to connect to your site in Safari. This practical tool is also useful for debugging non-browser-based React applications, like React Native apps. It can help simplify the process of optimizing and debugging your code, making your workflow more efficient.
In this article, you’ll learn how to install and use the standalone version of React DevTools to debug a React application running in Safari. In addition, the article also highlights the differences between the standalone version and the Chrome extension, as well as some limitations of the tools.
Use Cases for Debugging React Apps
The standalone version of React DevTools is a separate application that provides a powerful set of debugging and inspection tools for React applications. It’s independent of any specific browser and can be used across various platforms and environments. This makes it a versatile option for developers who need to debug their React apps in different contexts.
Some of the use cases for the standalone version of React DevTools include:
- Debugging non-browser-based React apps: The standalone version of React DevTools is particularly useful when debugging React Native applications because it is platform-independent and can connect to apps running on iOS or Android devices. For example, you can use it to determine why a specific component of your React Native app isn’t rendering correctly on an iOS device. You can use React DevTools to inspect the component tree, check component props and state, and identify issues with styling or logic that may be causing the rendering problem.
- Debugging React apps in Safari: Safari is a widely used browser, especially among macOS users. Although Safari has its own set of developer tools, it doesn’t have extensions or support for React applications like Chrome or Firefox. The standalone version of React DevTools can be used to debug React applications running in Safari, as it provides developers with a powerful set of tools to inspect components and diagnose issues. For instance, if a specific UI component in your React app doesn’t behave as expected when viewed in Safari, you can use React DevTools to inspect the component in question. You can check its state and props and identify any issues.
- Debugging server-rendered React apps: In most static site generators, React apps are server-rendered, which means components are rendered on the server side and sent as HTML to the client. In these scenarios, the standalone version of React DevTools can help you debug issues related to server-rendered components. For example, if you’re using a solution like Next.js or React Server Components to perform server-side rendering, you can use the standalone version of React DevTools to inspect the rendered components and identify issues related to data fetching, state management, or rendering logic.
How to Debug a React App in Safari
The following tutorial explains how to use the standalone version of React DevTools to debug a React application running in Safari. By the end, you’ll be equipped with the knowledge and tools you need to confidently debug your React application.
Prerequisites
To complete this tutorial, you’ll need:
- A Mac running Safari
- A code editor, such as Visual Studio Code
- Git installed on your machine
- Node.js and npm (the Node package manager) installed on your system
To verify the installation of Node.js and npm, execute these commands in your shell or terminal:
If they aren’t installed, download and install Node.js , which also automatically installs npm. This tutorial uses Node version 18.12.1 and npm version 8.19.2.
Creating a React Demo Application
You’ll first need to set up a basic React demo application, which you’ll run and debug in your Safari browser using the standalone version of React DevTools.
Create a new React project using Create React App by executing this command:
This command will generate a new folder with the specified name and populate it with boilerplate code for a React application.
Change the current directory to your newly created project folder by running the following command:
Execute the following command to start the development server:
Your React application should now be live at http://localhost:3000/ . Use your Safari browser to open the application:

Any modifications made to the source code will trigger an automatic page refresh.
Connecting Standalone React DevTools to Your App in Safari
To connect React DevTools to your app in Safari, you first need to install the standalone React DevTools package using npm from your terminal or shell:
Run React DevTools with this command:
After you run the command, you’ll get the following screen telling you to add an additional script to your React DOM :

This tutorial uses the script with the localhost link ( <script src="http://localhost:8097"></script> ) to connect the React application, but the LAN IP address also works. Since you’re not working with a mobile application, the localhost link will work just fine.
Go to your source project and open the index.html file in the public folder. Add the localhost link just after the <head> tag, then open React DevTools. You should see the following in the Components section:

Creating a User Listing
Once you have connected React DevTools to your application, you can use the various features it provides. These features include the ability to inspect the component tree, examine component state and props, and profile component performance.
As the sample application doesn’t have many components, you’ll only see the App component in the tree. To explore more features of React DevTools, you’ll need to add more components.
To add a User component, create a file named User.js in the src folder and add the following code to it:
This component displays user information, such as first name, last name, age, and date of birth (DOB).
You’ll now create a UsersList component that utilizes the User component to display the list of users. Create a file named UsersList.js in the src folder and add the following code to it:
To populate the list of users, you need to create some dummy data and wrap the UsersList component in the App component. To do this, replace the code in App.js with the following:
Note: The App component renders the UsersList component, which in turn renders each User component for every user in the list.
The application in your Safari browser should look like the following:

Debugging and Inspecting Your App
Now that your application is ready, you can start debugging it with React DevTools.
If you open React DevTools, you should see your application tree. It begins with the App component at the top, followed by the UsersList component, and ends with the User component:

If you click the UsersList component in the tree, the props that are passed to the component will be displayed in the right pane. In this case, the props include the array of users from your dummy data:

Clicking a User component displays the props that it passes (the user object in this case). You can click any of three User components and check their relative props:

When you use React DevTools to debug your application, it’s important to understand the application tree and how it represents the component hierarchy. The application tree can help you quickly identify rendering issues and data flow by providing a visual representation of the components. You can inspect the props and state of each component to pinpoint bugs and troubleshoot issues that may arise.
Additionally, you can pin the location of a selected component in your browser by clicking the eye icon in React DevTools:

Once this has been activated, it will highlight the component in light blue in your browser:

You can also log the selected component in the console by clicking the bug icon in React DevTools:

The following image shows the results in the browser when you click the bug icon:

Using React DevTools, you can gain a better understanding of the structure and behavior of your applications. You can also more easily identify and fix bugs and performance issues. The standalone version is particularly useful because it can be used with any React application, whether it’s running locally or on a remote server, and it provides a separate, dedicated window for debugging purposes. Overall, the standalone version of React DevTools is a practical tool for developing and debugging React applications.
Differences between Standalone React DevTools and the Chrome Extension
If you use the standalone version of React DevTools, you’ll be able to use it with any browser, not just Safari. It also offers more customization options and flexibility compared to the Chrome extension. The following are some other differences between the two versions:
- Cross-platform compatibility: The standalone version of React DevTools is designed to work across various platforms, including browsers and devices, enabling a broader range of debugging and development possibilities. Chrome extensions, on the other hand, are limited to working within the Chrome browser environment.
- Ease of setup and connection: Chrome extensions are designed to integrate seamlessly with the browser, so using the extension version makes it easy to detect and connect to React apps running in the browser. The standalone version of React DevTools often requires manual configuration to connect to the target app, which can be more time-consuming and error-prone.
- Updates and maintenance: These two versions of React DevTools may have different release schedules and update processes. Chrome extensions typically update automatically with the browser, while the standalone version may require manual updates.
Limitations of Standalone React DevTools
It’s also important to be aware that the standalone version of React DevTools has some limitations. For instance, the tool may not work as effectively with certain types of components, such as those built with third-party libraries. You may need to use additional tools or methods to gather the necessary information if the tool provides limited data.
The following are some of the most notable limitations:
- Browser-specific features: The standalone version of React DevTools may lack some browser-specific features, such as network request inspection, JavaScript debugging, or browser performance profiling. For these features, developers need to use the browser’s built-in developer tools or rely on other debugging solutions tailored for the specific browser.
- Integration with browser environment: The standalone version doesn’t have the same level of integration with the browser environment as the extensions. Certain tasks, like interacting with browser APIs or manipulating the DOM, may be more challenging or impossible to accomplish using the standalone version.
- Learning curve: Due to differences in features, interface, and setup process, developers may need to invest additional time in learning how to use the standalone version of React DevTools. This may slow down their development process, especially if they are already familiar with the Chrome extension.
- Performance and resource usage: The standalone version of React DevTools may have different performance characteristics and resource usage compared to the Chrome extension version. Depending on the specific tools and configurations used, developers may experience varying levels of performance and resource consumption, which can impact their development experience.
By keeping these limitations in mind, you can adjust your approach and optimize your code more effectively. For instance, you can use alternative tools or workarounds to gather the information you need.
The standalone version of React DevTools offers a versatile solution for developers who need a powerful and flexible set of debugging tools, whether they’re working on browser-based React apps or non-browser-based applications like React Native apps.
This article introduced the standalone version of React DevTools and demonstrated how to use it to debug a React app running in Safari. You should now be comfortable with setting up, connecting, and using React DevTools to inspect and debug your React applications. With the knowledge from this article, you’ll be able to debug your React applications, regardless of the environment or browser they are running in.
You can find the code that was used in this article in this GitHub repository .
By Lucien Chemaly
Lucien has a Master's and Engineering Degree in IT and Telecommunications from the University of Rennes, France. He teaches seasonal courses for engineering students at the Saint Joseph University of Beirut and has been involved in programming training for private companies. He also writes for Draft.dev.

Build a Blog that Software Developers Will Read
The Technical Content Manager’s Playbook is a collection of resources you can use to manage a high-quality, technical blog:
- A template for creating content briefs
- An Airtable publishing calendar
- A technical blogging style guide
Simulate different devices and screen sizes
All browser DevTools have a built-in mode that you can use to test a webpage under different screen sizes and device capabilities.
As a web developer, it is very important to realize that your website won't only be used on one type of device. People browse the web with many different device types, from small phones, to large desktop monitors, and everything in between.
Not only do the devices people use have different screen sizes, but they can also have different pixel densities, support for touch input, network speeds, and more.
Browser DevTools make it easy to simulate how a webpage might render under different screen sizes and device capabilities. However, note that this is only a simulation , and you should always test your webpage on the real device too. For example, even if the device mode in Chrome DevTools lets you simulate an iPhone screen, it doesn't actually render the webpage with the same rendering engine as the iPhone would. So, always test on the real device too.
Available features #
This simulation mode comes with the following features (more might be available depending on the browser you're using):
- Resize the simulated viewport size by hand.
- Choose one of the pre-defined devices to simulate.
- Create your own simulated devices .
- Capture screenshots .
- Throttle the network speed to test your website on slower connections .
Start simulating #
In chrome #.
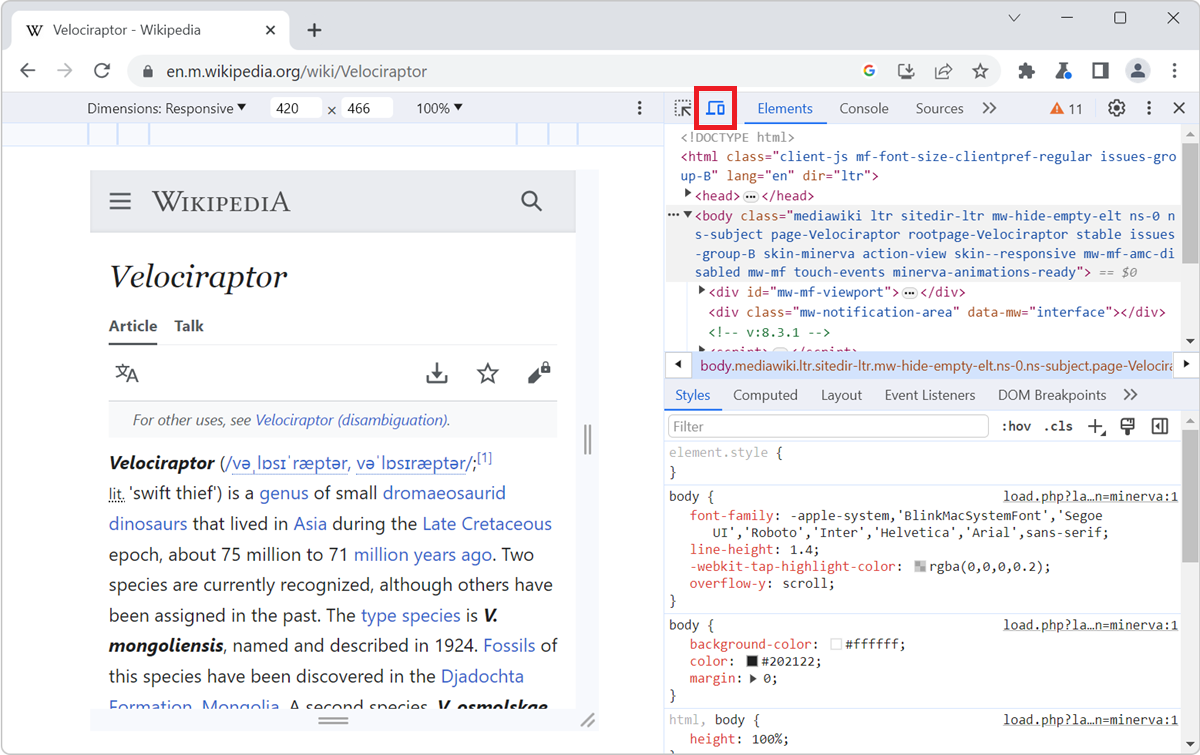
To enable the device mode in Chrome DevTools, click the Toggle Device Toolbar button or press Ctrl+Shift+M (or Cmd+Shift+M on macOS).
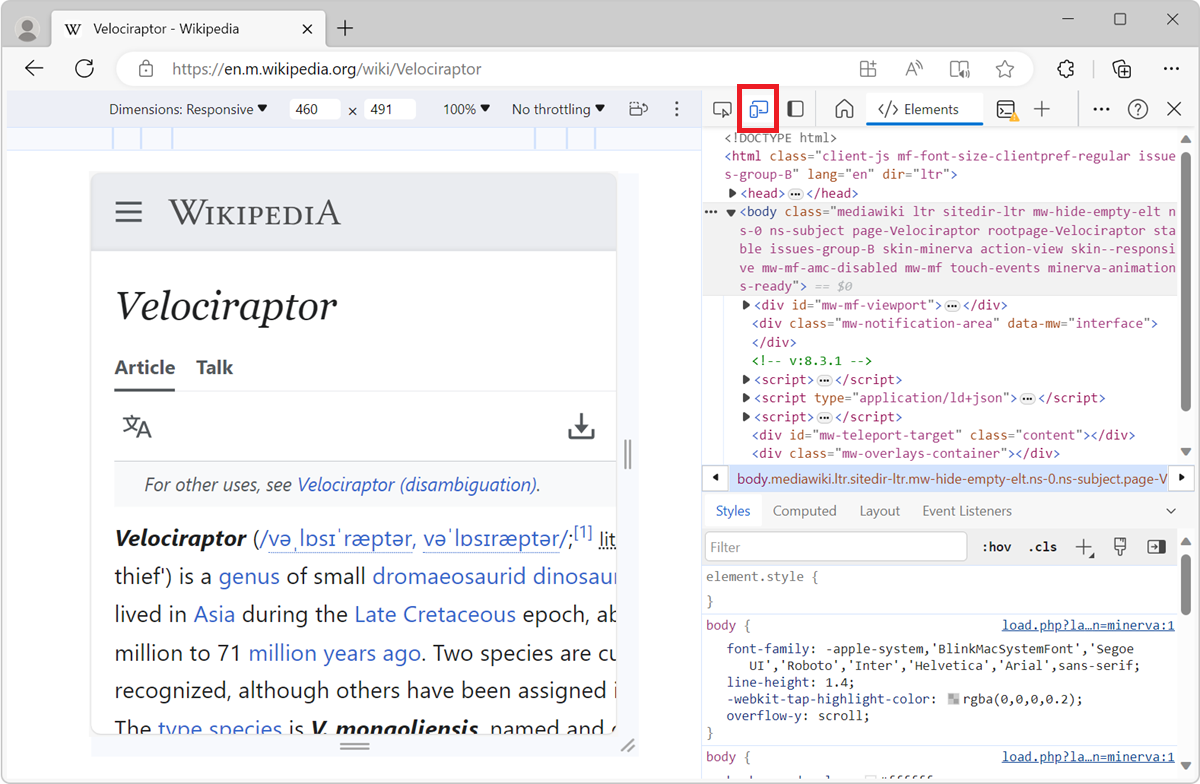
To enable the device mode in Edge DevTools, click the Toggle device emulation button or press Ctrl+Shift+M (or Cmd+Shift+M on macOS).
In Firefox #
In Firefox, you don't need DevTools to be opened to simulate devices. Click Open application menu > More tools > Responsive design mode , or press Ctrl+Shift+M (or Cmd+Shift+M on macOS).
Or, if you're in DevTools, click the Responsive Design Mode button, or press Ctrl+Shift+M (or Cmd+Shift+M on macOS).
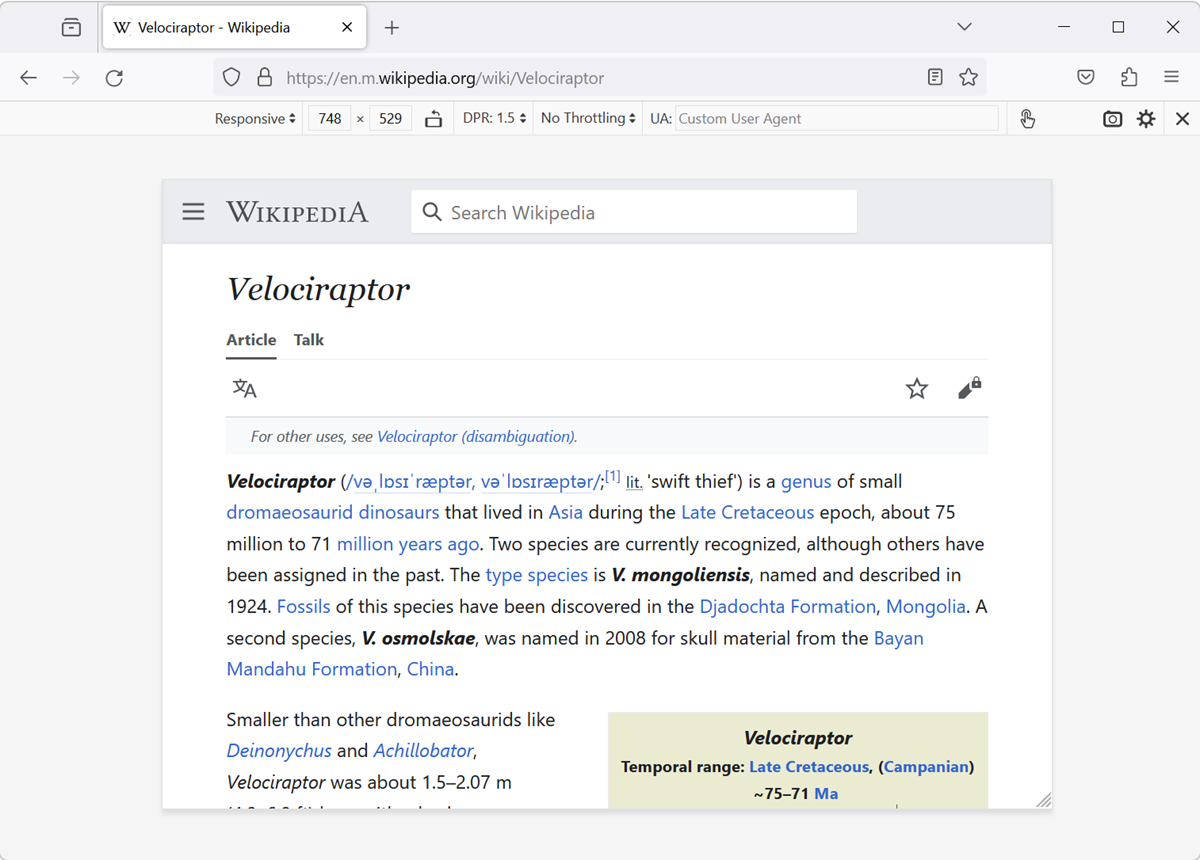
In Safari #
In Safari, you don't need DevTools to be opened to simulate devices. Click Develop in Safari's menu bar, and then click Enter Responsive Design Mode , or press Ctrl+Command+R .
If you aren't seeing the Develop menu item, enable it first (this only needs to be done once):
- In Safari, in the menu bar, go to Safari > Settings .
- Select the Advanced tab.
- Click Show features for web developers .
In Polypane #
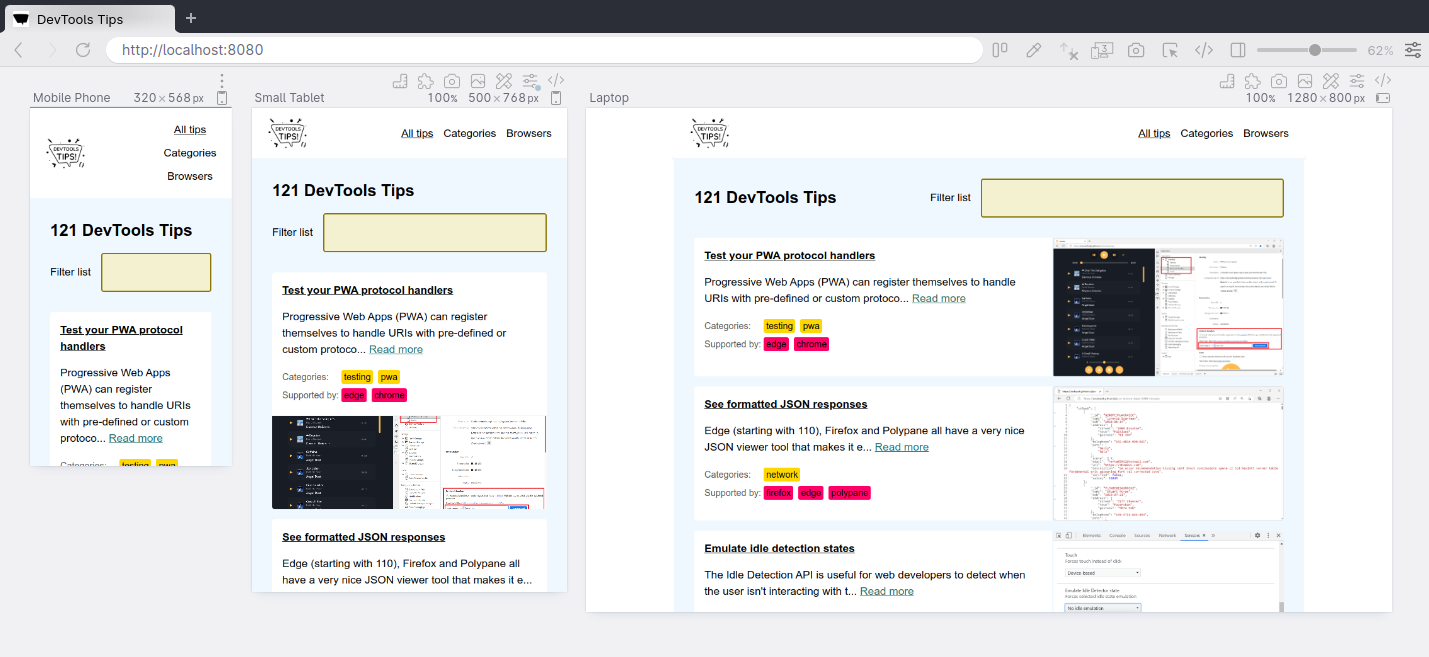
Simulating different screen sizes is Polypane's default behavior. Polypane is the only browser DevTools that allows you to see multiple screen sizes side by side too. To learn more, see Simulate multiple devices that are kept in sync .
Last edit: 10/19/2022 - Edit this page
React Developer Tools
Use React Developer Tools to inspect React components , edit props and state , and identify performance problems.
You will learn
- How to install React Developer Tools
Browser extension
The easiest way to debug websites built with React is to install the React Developer Tools browser extension. It is available for several popular browsers:
- Install for Chrome
- Install for Firefox
- Install for Edge
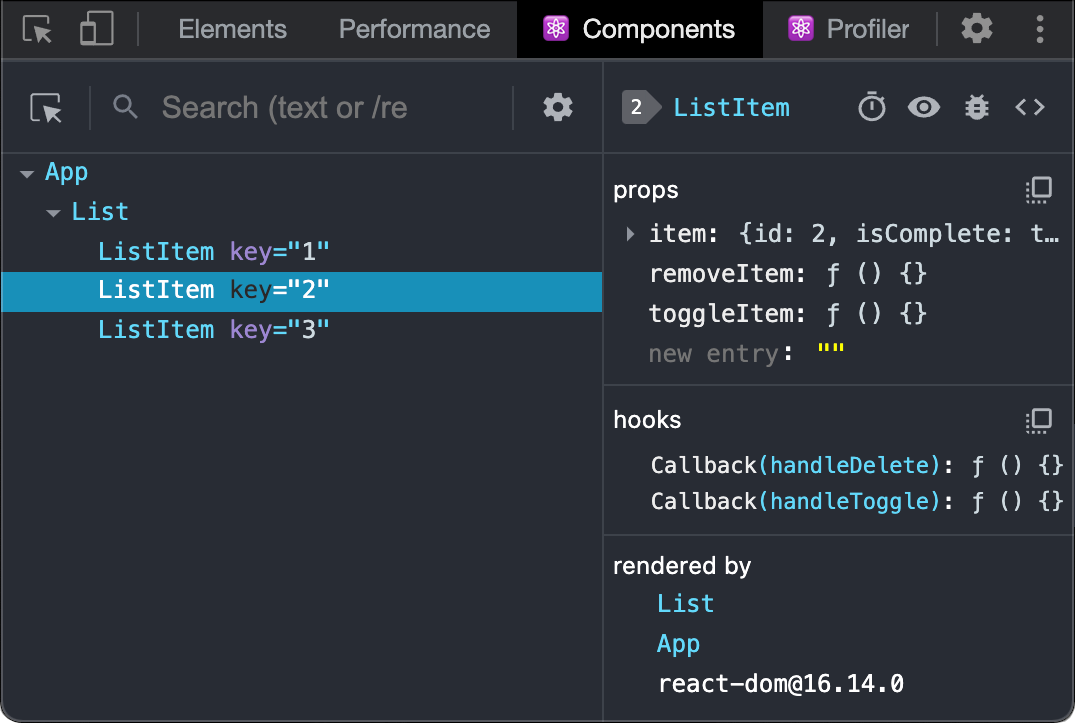
Now, if you visit a website built with React, you will see the Components and Profiler panels.
Safari and other browsers
For other browsers (for example, Safari), install the react-devtools npm package:
Next open the developer tools from the terminal:
Then connect your website by adding the following <script> tag to the beginning of your website’s <head> :
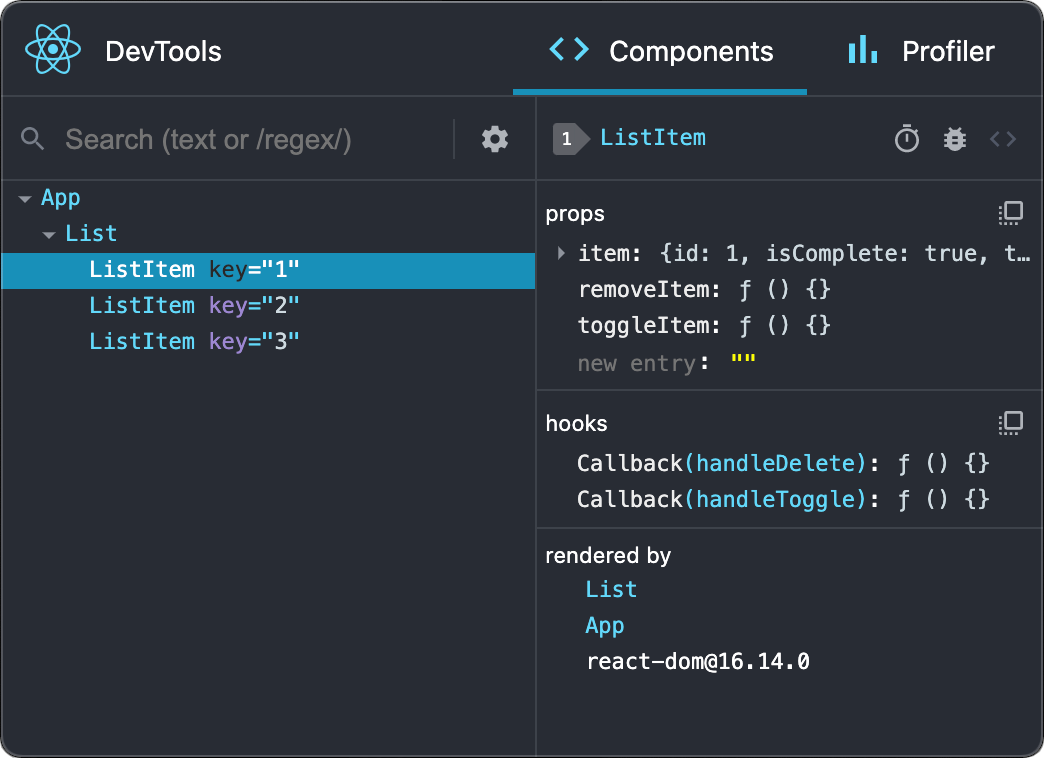
Reload your website in the browser now to view it in developer tools.
Mobile (React Native)
React Developer Tools can be used to inspect apps built with React Native as well.
The easiest way to use React Developer Tools is to install it globally:
Next open the developer tools from the terminal.
It should connect to any local React Native app that’s running.
Try reloading the app if developer tools doesn’t connect after a few seconds.
Learn more about debugging React Native.

- #InmagicPresto
- #knowlegemanagement
- #speciallibraries
- #SydneyEnterprise
- #archivalcms
- #CollectionsManagement
- #archivists
- #ArtificialIntelligence
- #LibraryAutomation
- #MuseumSoftware
- #archivescollectionsmanagement
- #digitalarchives
- #librarians
Social Media Profiles
- Lucidea on Facebook
- Lucidea on Twitter
- Lucidea on Linkedin
- Lucidea on Youtube
- Español – América Latina
- Português – Brasil
- Tiếng Việt
- Chrome DevTools
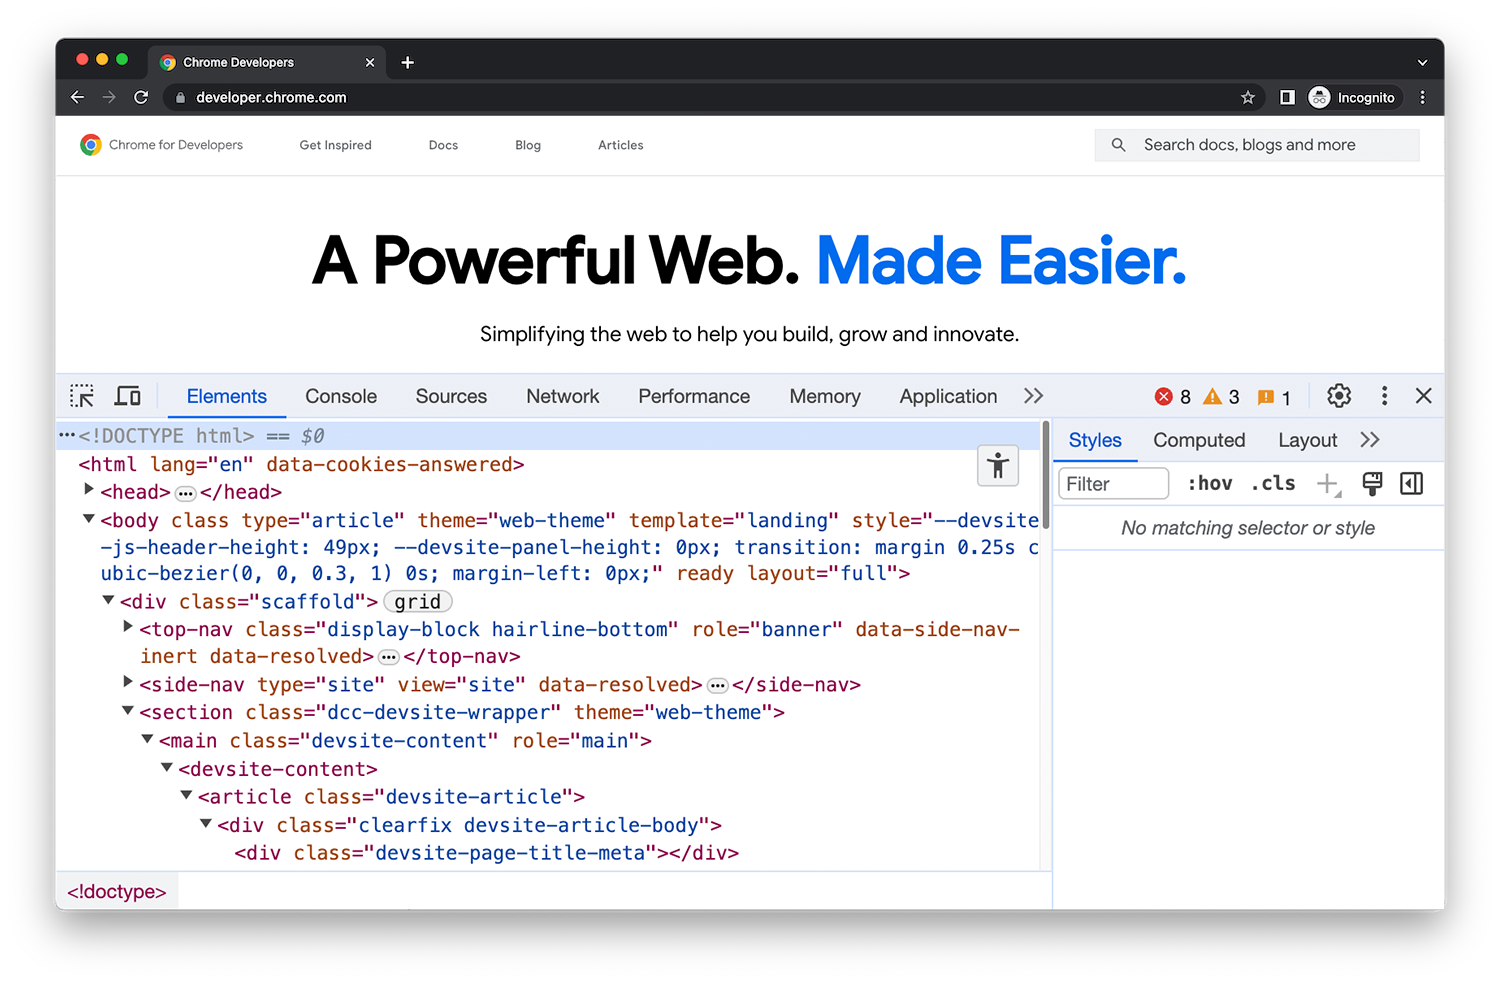
Open DevTools
What's new in devtools, devtools tips, commands and shortcuts, run commands in the command menu, keyboard shortcuts, disable javascript, simulate mobile devices with device mode, search across loaded resources, elements - dom, elements - css, performance, application, memory inspector, network conditions, developer resources, css overview, performance insights, settings reference, preferences, experiments, ignore list.

IMAGES
VIDEO
COMMENTS
Apple has brought its expertise in development tools to the web. Safari includes Web Inspector, a powerful tool that makes it easy to modify, debug, and optimize websites for peak performance and compatibility on both platforms. And with Responsive Design Mode, you can preview your web pages in various screen sizes, orientations, and resolutions.
Open Safari on your Mac and click the "Safari" button in the menu bar. Next, select "Preferences." Alternatively, you can use the keyboard shortcut Command+, (comma). This will also open up Safari preferences. Go to the "Advanced" tab. Check the box for "Show Develop Menu in Menu Bar." Now the Develop menu will appear between Bookmarks and ...
AhmedHalat • 3 yr. ago. I also like being able to change code (like js source) onsite so I can easily test solutions without having to edit in the IDE and republish. I still rather prefer using Safari since I use it as my daily driver (much better than Chrome for a someone deep in the ecosystem) and I'd rather not use Chrome just for dev work. 3.
Taking a cue from the Google Chrome Developer tools, the Safari Web Inspector allows you to navigate through the structure of your site as a tree. You can expand elements to see their contents, and open links or images. ... Like Google Chrome, the Safari Developer Tools offers a view of your side load on a timeline. However, Safari makes the ...
Like Chrome, Safari can handle multiple tabs without slowing down, making it a great choice for users who like to have multiple tabs open at once. ... Safari's developer tools include features like the console, network inspector, and timeline tools to help pinpoint and troubleshoot issues on web pages. Additionally, Safari supports WebKit, a ...
While historically Safari lagged behind Chrome and Firefox's devtools, modern Safari has caught up and offers a robust toolset that's invaluable for building progressive web apps and mobile web experiences. Some key benefits of Safari developer tools include: Integrated responsive design features like device frames, network throttling, and ...
The dev tools window can be docked to the bottom of the Safari window for more vertical space. Open multiple instances of dev tools to compare different pages side-by-side. Learn keyboard shortcuts for common debugging actions like pause, step over, log, etc. Enable the experimental features tab for tools like WebGL profiler, layer borders, and ...
With Firefox, Chrome, and Edge (and all Chromium-based browsers) having dedicated tools for visualizing and debugging CSS grids, Safari was the last major browser not to have this. Well, now it does! Fundamentally, Safari now has the same features just like other browsers' DevTools in this area.
Chrome: More tools Developer tools; Safari: Develop Show Web Inspector. If you can't see the Develop menu, go to Safari Preferences Advanced, ... This tool shows what the HTML on your page looks like at runtime, as well as what CSS is applied to each element on the page. It also allows you to instantly modify the HTML and CSS and see the ...
Overview. Safari includes features and tools to help you inspect, debug, and test web content in Safari, in other apps, and on other devices including iPhone, iPad, Apple Vision Pro, as well as Apple TV for inspecting JavaScript and TVML. Features like Web Inspector in Safari on macOS let you inspect and experiment with the layout of your ...
iOS 16.4 or greater. Chrome 115 or greater. On your Mac you need: The Safari Develop menu enabled. Enable this from Safari application settings, Advanced Settings tab. On your iOS device launch the Chrome app and navigate to Settings. In Content Settings, enable Web Inspector. Relaunch Chrome for iOS after changing this setting.
LambdaTest (commercial) will help you to perform manual cross browser testing on a combination of 2000+ browsers & operating systems. Users will be able to record video of complex bugs and eve share it via integrations like MS Teams, Slack and more. Users can speed-up their testing by running tests in parallel.
Although Safari has its own set of developer tools, it doesn't have extensions or support for React applications like Chrome or Firefox. The standalone version of React DevTools can be used to debug React applications running in Safari, as it provides developers with a powerful set of tools to inspect components and diagnose issues.
Especially since every time someone show me THE killer feature in the chrome dev tools I come back to show the exact same feature in Safari. I use Safari and the Safari Technology Preview, but I have to admit that STP is frustrating to use during the macOS beta period. I get that Chrome/Chromium is more used though.
To access the Responsive Design Mode, enable the Safari Develop menu. Follow the steps below to enable the Develop menu: Launch Safari browser. Click on Safari -> Settings -> Advanced. Select the checkbox -> Show Develop menu in menu bar. Once the Develop menu is enabled, it'll show up in the menu bar as shown in the image below: Note ...
Connect your device to your Mac using a USB cable, or try the following over Wifi. On your Mac, in Safari, click the Develop menu. Near the top of the menu you should see your iPad or iPhone listed. Hover over your device in the menu and you'll see Safari with each tab listed below. Click the one you want to debug.
2. Safari and Chrome use different debugging protocols (initially these were very similar, but over time they grew into separate things). Thankfully, there is a Google project that does the translation between these protocols - iOS WebKit Debug Proxy. It doesn't mention desktop Safari though. Thanks. I was afraid this was the case--I wasn't ...
In Safari, you don't need DevTools to be opened to simulate devices. Click Develop in Safari's menu bar, and then click Enter Responsive Design Mode, or press Ctrl+Command+R. If you aren't seeing the Develop menu item, enable it first (this only needs to be done once): In Safari, in the menu bar, go to Safari > Settings. Select the Advanced tab ...
7. Just found a way to do it without having to use a proxy like Charles: Install XCode. Connect iPhone to mac via USB. Launch XCode. Access developer settings on iPhone. Use "Network Link Conditioner". Longer blog post I wrote: Enable network throttling on iPhone in 5 steps. Hope this helps!
The easiest way to debug websites built with React is to install the React Developer Tools browser extension. It is available for several popular browsers: Install for Chrome; Install for Firefox; Install for Edge; Now, if you visit a website built with React, you will see the Components and Profiler panels. Safari and other browsers
Google has also ensured that developers like you have a great experience with Chrome. The Developer Tools, bundled and available in Chrome and Safari, allows web developers and programmers deep access into the internals of the browser and their web application. The Developer Tools are part of the open source Webkit project.
Lucidea is the market leading developer of a full portfolio of museum and archival collections management systems, and knowledge management/library automation software.
Chrome DevTools is a set of web developer tools built directly into the Google Chrome browser. DevTools lets you edit pages on-the-fly and diagnose problems quickly, which helps you build better websites, faster. Get started. Open DevTools All of the ways that you can open Chrome DevTools. ...
New advances in detection and the development of vaccines and other tools can help reduce the burden of disease in LMICs and prevent outbreaks from turning into global crises. Interactions: Understanding the interplay between nutrition, immunity, infectious diseases, cardiometabolic and other noncommunicable diseases, and developmental outcomes ...