- Sustainable
- Energy Economy
- Energy Services

What is Round Trip Efficiency?

Energy storage systems function by taking in electricity, storing it, and subsequently returning it to the grid. The round trip efficiency (RTE), also known as AC/AC efficiency, refers to the ratio between the energy supplied to the storage system (measured in MWh) and the energy retrieved from it (also measured in MWh). This efficiency is expressed as a percentage (%).
The round trip efficiency is a crucial factor in determining the effectiveness of storage technology. A higher RTE indicates that there is less energy loss during the storage process, resulting in a more efficient overall system. Grid systems engineers strive for energy storage systems to achieve an 80% RTE whenever feasible, as it signifies a desirable level of efficiency and minimizes energy losses.
What Factors Can Affect the Round Trip Efficiency of an Energy Storage System?
The RTE of an energy storage system can be influenced by various factors, including:
1. Technology: Different storage technologies have varying round-trip efficiencies. For example, hydro storage typically ranges from 65% in older installations to 75-80% in modern deployments, while flywheels have efficiencies of about 80% to 90%. Some battery technologies can have round-trip efficiencies ranging from 75% to 90%.
2. Storage duration: Some technologies may experience leakage or energy loss over long-term storage, which can affect round-trip efficiency. It is important to consider the specific characteristics and limitations of the storage technology when evaluating its efficiency.
3. Age and condition of the system: Older storage systems may have lower round-trip efficiencies compared to newer ones. Factors such as wear and tear, component degradation, and maintenance practices can impact the overall efficiency of the system.
4. Charging and discharging rates: The speed at which energy is charged into and discharged from the storage system can affect its efficiency. Certain technologies may have lower efficiencies at high charging or discharging rates.
5. System design and control: The design and control strategies implemented in the energy storage system can influence its round-trip efficiency. Optimal system design, efficient power electronics, and effective control algorithms can improve the overall efficiency of the system.
6. Temperature: Temperature can have an impact on the performance and efficiency of energy storage systems. Extreme temperatures can affect the efficiency of certain storage technologies, such as batteries, leading to lower round-trip efficiencies.
Considering these factors is crucial when evaluating the round-trip efficiency of an energy storage system, as they can significantly affect its performance and effectiveness in storing and retrieving energy.
Must Read: What is Power Conversion Efficiency?

Elliot is a passionate environmentalist and blogger who has dedicated his life to spreading awareness about conservation, green energy, and renewable energy. With a background in environmental science, he has a deep understanding of the issues facing our planet and is committed to educating others on how they can make a difference.
Related Posts
?")
What is Heating Seasonal Performance Factor (HSPF)?
?")
What is Annual Fuel Utilization Efficiency (AFUE)?

What is Grid Parity?
Save my name, email, and website in this browser for the next time I comment.
Type above and press Enter to search. Press Esc to cancel.
Advertisement
Energy Storage with Highly-Efficient Electrolysis and Fuel Cells: Experimental Evaluation of Bifunctional Catalyst Structures
- Original Paper
- Open access
- Published: 13 January 2023
- Volume 66 , pages 546–559, ( 2023 )
Cite this article
You have full access to this open access article

- Enno Wagner ORCID: orcid.org/0000-0003-3170-8020 1 ,
- Erik Delp 1 &
- Rakesh Mishra 2
2904 Accesses
4 Altmetric
Explore all metrics
With the roll-out of renewable energies, highly-efficient storage systems are needed to be developed to enable sustainable use of these technologies. For short duration lithium-ion batteries provide the best performance, with storage efficiencies between 70 and 95%. Hydrogen based technologies can be developed as an attractive storage option for longer storage durations. But, common polymer electrolyte membrane (PEM) electrolyzers and fuel cells have round-trip system efficiencies of only 30–40%, and platinum and rare iridium catalysts are needed. Thus, it is a major challenge to increase the energy conversion efficiency of electrolyzers and fuel cells significantly, and at the same time to use non-precious catalysts. The present work experimentally examines the usefulness of a bifunctional NiC catalyst in two different assemblies: an alkaline fuel cell (AFC) with electrolyte gap and gas diffusion electrodes and an alkaline membrane electrolyzer (AEL). The performance characteristics of the novel system are compared with a reversible PEM fuel cell. While the AEL reaches acceptable power densities, the PEM based system still performs better than the proposed system. The AFC with an electrolyte gap provides remarkable results as it shows vanishingly small overvoltage during electrolysis at temperatures around 90 °C and current density of 100 mA cm −2 : an electrolyzer efficiency of about 100% could be achieved for the single cell. The round-trip efficiency was also very high: 65% were realized with 50 mA cm −2 . While the current density must be improved, this is a promising result for designing highly-efficient energy storage systems based on alkaline fuel cells.
PEM water electrolysis for hydrogen production: fundamentals, advances, and prospects

A Review of Rechargeable Zinc–Air Batteries: Recent Progress and Future Perspectives

High-Entropy Strategy for Electrochemical Energy Storage Materials
Avoid common mistakes on your manuscript.
1 Introduction
The climate Change and its consequences are the most important problems that the civilization faces today. The sixth report of the Inter-governmental Panel on Climate Change (IPCC) has now provided a clear correlation between greenhouse gas emissions from human activities and rapid climate change. To avoid dramatic ecological and economic consequences due to drought disasters, storms and heavy rain, the global warming must be limited to 1.5 °C [ 1 ]. To achieve this, the global energy infrastructure needs to change to a CO 2 -neutral energy infrastructure. This is a major challenge that needs to be addressed urgently through world-wide collaboration and concerted research efforts.
While the infrastructure of concentrated fossil energy carriers like oil and natural gas is a uni-directional distribution system, which is characterized by continues supply and high profits, the use of renewable energies is quite different. Wind, water and solar power require large areas to collect the energy and daily and seasonal fluctuations lead to a need of an integrated sophisticated storage systems. In future, it is expected that nearly all the stake holders of the energy network will be both—consumers and producers of renewable energy. Thus, the existing models of energy economy will undergo substantial changes. Stefan Rohrmoser from the Eaton network company predicts: Rather than the tree structure, we need a flexible cellular structure that resembles an actual web, with multiple interconnections and pathways for energy to travel [ 2 ].
Since photovoltaic systems produce today cheaper energy than the conventional power plants, these systems are expected to be installed on a large scale—from single houses to huge areas on industrial buildings or on agriculture land. To compensate the daily fluctuations and to meet supply and demand gap, the first mean of choice for energy storage are lithium-ion batteries, since they have a high degree of efficiency of above 90% [ 3 ]. In [ 4 ] a storage efficiency around 95% is reported. Efficiencies of Lithium-Ion Batteries in residential homes are reported to be in the range of 82–89% [ 5 ]. To meet world-wide energy storage requirements, this option would mean, use of huge amount of raw materials like lithium, cobalt and rare-earth elements. Also, geo-political situation in many of the producing countries of these metals are quite challenging. Against this background, alternatives for storing electricity from renewable resources need to be developed, especially when high capacities for long-term storage are needed. In an actual study from the Fraunhofer Institute of Solar Energy Systems ISE in Freiburg, Germany, the total greenhouse gas emissions over the entire lifecycle (including, production, use and disposal) of lithium-ion batteries are compared with fuel cell systems, considering also the origin of all the consumed energy [ 6 ]: with storage capacities above 60 kWh, fuel cell systems show a lower greenhouse gas food print than batteries.
During the last decades, especially the PEM technology with polymer electrolyte membranes has been developed to be used in various technical applications and it has provided reliable operation stability. In the automotive industry, PEM fuel cells are currently being developed with current densities between 2 and 3 A cm −2 [ 7 ]. The results of different PEM fuel cells are presented in [ 8 ] with current densities around 1.5 A cm −2 at usable voltages of around 0.6 V. The efficiencies of these cells are in the range of 40–50%.
During energy transition, green hydrogen is a beacon of hope for the heavy industry, as it is assumed that it will be used to drive trucks and help to decarbonize industrial processes like the steel and glass production [ 9 ]. Therefore, huge amounts of this renewable gas must be produced, preferentially close to large wind farms at the coast. Industrial companies are now developing high-power electrolyzers, also based on the PEM technology for this purpose. In [ 10 ] improved polymer electrolyte membrane water electrolysis has been shown to have very high current densities up to 5 A cm −2 while the efficiency is around 65%. This is indeed a great success in bringing the technology to an industrial scale of the megawatt range. On the other hand, the PEM electrolysis technology is still not very cost-effective. Especially at the oxygen side a high corrosive potential prevails, allowing only noble platinum and iridium catalyst to be used. The conductor plates must be milled from titanium which results in very high production costs. Furthermore, if the entire energy path of green hydrogen is considered, including electrolysis, auxiliary devices, gas compression, transportation and reconversion into electricity, the round-trip efficiency is only about 30%. While the power density can be generally increased by using thinner membranes, the efficiency of acid polymer electrolyte membranes cannot be increased furthermore due to electrochemical limits. Thus, alternatives for high-efficient energy conversion with hydrogen need to be explored.
Comparing all types of fuels cells, alkaline electrolysis and fuel cells show the highest efficiencies of all. Therefore, the alkaline technology should be discussed in detail as it is the main topic of the present work. It is in this context, that F.T. Bacon should be mentioned, a pioneer who spend all his power and motivation for researching the alkaline technology [ 11 ]. In the 1940th Bacon and his team developed the first technical useful alkaline fuel cells with porous nickel electrodes on both sides of an electrolyte gap. After some problems with the stability of the oxygen electrode due to nickel-oxide, very good results were obtained with a lithium treatment. The sintered nickel electrode was soaked with a solution of lithium-hydroxide (LiOH) and then tempered at 700 °C for some minutes. Thus, a corrosion-resistant oxygen electrode was built which was stable in high concentrated potassium hydroxide at temperatures of about 200 °C and pressures around 40 bar. Under this high reactive condition, current densities up to 1 A cm −2 were achieved. Remarkably, a high cell voltage of 900 mV at current density of more than 300 mA cm −2 was achieved, corresponding to an efficiency of about 60% [ 11 ]. The early space operations and the Apollo missions were equipped with alkaline fuel cells based on this principle [ 12 ]. This early work of F.T. is relevant for the current work, since very high efficiencies of the alkaline technology were presented here for the first time.
Furthermore, the Siemens Company in Germany has been at the fore front of developing several alkaline fuel cell systems in 1960s. The classic design of the AFC has a small gap of about 2 mm thickness with an electrolyte flow (30 wt% potassium hydroxide as mobile electrolyte). Powder electrodes with porous nickel and silver at the oxygen side were pressed with a gas pillow from both sides on asbestos diaphragms. With temperatures of around 80 °C and gas pressures of about 2 bar these cells show quite good efficiency. At 300 mA cm −2 the cell voltage was still above 850 mV. In a different design, the potassium hydroxide (KOH) is fixed (immobile electrolyte) in a matrix structure and the electrodes also contained some platinum. With these cells at current density of 400 mA cm −2 the cell voltage showed values above 900 mV [ 13 ]. This high efficiency (around 60%) at high useful power density has never been reached with modern PEM fuel cells which typically show voltages around 700 mV (47% efficiency) at this current density. It thus underscores the potential of the alkaline technology to achieve high efficiencies.
In the last decade a significant increase in publications about alkaline membranes has been observed [ 14 ]. The main motivation seems to be able to combine the high-power density of PEM fuel cells with the high efficiency of alkaline fuel cells and with an aspired cost reduction using low-price non-platinum group catalysts. While especially polymer electrolyte electrolyzers have a high corrosive potential, only noble catalysts like platinum und ruthenium are stable during oxygen evolution reaction (OER). These catalysts are also suggested for reversible PEM fuel cells [ 15 ]. If only the fuel cell mode is considered, the noble catalysts can be supported on carbon particles, for both, the hydrogen oxidation reaction (HOR) and the oxygen reduction reaction (ORR), the catalyst loading can be reduced to less than 0.5 mg cm −2 [ 12 ] with nanoparticles loadings of 0.1 mg cm −2 are possible today [ 7 ].
In the alkaline media a wide range of catalyst use has been reported. For the hydrogen reaction Pt, Pd, RANEY-Ni, NiMo, CoNiMo and Ni 3 N have been shown to be useful catalysts. For the oxygen reaction Pt, Pd, PtRu, Ag, Co 3 O 4 , MnO 2 are typically used with considerable success. In [ 16 ] several transition metals (Mo, Co, Fe, Cu) have been suggested for the alkaline HOR process. Also use of carbon nanotubes (CNT) as support and dopants with nitrogen, sulphur and boron has been reported. In [ 17 ] several bi-functional catalysts have been investigated for the usefulness for alkaline fuel cells using rotating disc technology and cyclic voltammetry. Traditionally, silver has been found to be one of the best catalysts for the ORR in alkaline fuel cells, as published extensively [ 18 , 19 , 20 , 21 ]. In the present work a nickel-carbon catalyst showed promising suitability for the oxygen reaction.
For obtaining high current densities like PEM fuel cells, modern AEMs (anion exchange membranes) have been developed which normally have thickness in the range of 20 to 100 microns, conductivities around 100 mS cm −1 and these deliver current densities above 500 mA cm −2 [ 16 ]. Alkaline membranes were originally used for water treatment and are based on a PBI structure. They were also used in classic alkaline water electrolyzers completely dipped into liquid electrolyte. In fuel cells this is not practicable because the liquid will leak out and even partly drying may destroy the structure. Since embrittlement is a well-known problem, these membranes must always be kept humidified e.g., with 1.0 M KOH [ 16 ]. Another problem is the formation of carbonates (K 2 CO 3 ) when the cations meets the carbon-dioxide from the air. Thus, a modern type of membrane has been developed which is called anion exchange membrane (AEM). Here, the functional group is chemically bounded on the structure, while the hydroxide ions are movable—thus, comparable to a PEM. Because no free cations are available, the formation of carbonates is no longer a problem and these type of fuel cells can be operated with air. Commercial products of these AEMs are available from IONOMR (Canada), FUMATECH (Germany) and DIOXIDE MATERIALS (US) with the SUSTAINION membrane. The polymer-backbone of these membrane structures could be polyethylene, polyphenylene or poly-ether-ether-ketone (PEEK) which is very stable even at high temperature. Often, the base is also polyether-sulfone (PES or PESU) [ 22 ]. With AEMs significantly high current densities can be obtained. In [ 23 ] a power density of 1.4 W cm −2 is reported with current densities around 3.0 A cm −2 . In [ 14 ] current densities of 4.0 A cm −2 given and [ 16 ] presents current densities of even 6.0 A cm −2 . However, all these AEMs have a catalyst loading of platinum and ruthenium like conventional PEM fuel cells.
It can be concluded that AEMs are not enough stable at higher temperatures because partly drying and embrittlement can damage the membranes. This is the reason for the lack of availability of commercial fuel cells equipped with AEMs. In electrolyzers the risk is much lower since there is always liquid water at the membrane. The ENAPTER company is starting production of small modular electrolyzer devices using AEMs, but temperature level and efficiency are still relatively low. This is unfavorable since much high efficiencies can be reached with alkaline systems especially at high temperatures.
Since alkaline membranes are sensitive to high temperatures, a promising attempt is given in [ 24 ], avoiding the use of any membrane. In a small test cell, a capillary flow of electrolyte is feeding a porous structure made of a hydrophilic polyether-sulfone (PES) separator in-between two electrodes. Hydrogen and oxygen evolution can be obtained without the formation of bubbles. The results are impressing: at current densities of 500 mA cm −2 the electrolyzer cell works with a voltage of only 1.51 V, corresponding to an efficiency of about 98%.
Because of the above-mentioned shortcomings of alkaline membranes, the authors of the on-hand work are following a similar approach like [ 24 ] with the focus on highly-efficient electrochemical energy conversion in porous catalyst structures—without any membrane. Therefore, a cost-efficient alkaline fuel cell in the classic design with gas diffusion electrodes on two sides of an electrolyte gap has been developed and was presented in a previous work [ 25 ]. Here, different electrodes have been examined to provide answers to the following unanswered question: are there useful non-platinum group catalysts for designing a regenerative alkaline fuel cell? A cost-efficient bifunctional catalyst based on a mixture of RANEY-Nickel, PTFE and a stable carbon shows promising results in both, fuel cell as well as electrolyzer mode. In the present work these studies were extended while two different cell designs are compared. The overriding goal is to find an optimal configuration of catalysts, electrode structure and cell design for alkaline electrolyzers and fuel cells with highest efficiency, high power density and low-cost production potential.
2 Fundamentals
In fuel cells the chemical energy of the hydrogen is directly converted into electric energy using an electrochemical process. The maximum effectively useful energy (exergy) is given by the GIBBs free reaction enthalpy ΔG . Hereby, the bond enthalpy ΔH represents the chemical energy of the hydrogen and cannot be fully converted into electrical energy. It is diminished by a term of the absolute temperature T and the change of entropy ΔS .
When hydrogen and oxygen react to water the total number of molecules will be reduced. This is accompanied with a reduction of entropy, since the number of molecules is directly related to the entropy through the BOLZMANN constant. But, in a closed system the entropy cannot be reduced spontaneously due to the second law of thermodynamics. Thus, heat must be discharged into the environment in the same quantity as the term TΔS . This heat energy is lost and cannot be used for producing electric energy. In electrolysis mode it is the other way around: here the number of molecules will increase and with it the related entropy, while heat must be delivered into the system. If the electrochemical cell is working below the thermoneutral voltage ( E 0 = ΔG 0 /z F ) which is around 1.48 V, heat can be used to produce hydrogen. The electrical efficiency (electrical energy to hydrogen) is then above 100%.
Alkaline fuel cells and electrolyzers in the classic design are generally based on an aqueous solution of potassium hydroxide (KOH). Here, the hydroxide ions (OH − ) are responsible for the electrochemical current in-between the electrodes. In fuel cell mode (gas consumption) hydroxide ions are produced at the oxygen electrode and consumed at the hydrogen electrode. In electrolysis mode (gas production) the flow direction is reverse. The electrochemical equations are given below; they are reversible in general:
The hydrogen oxidation can be divided into three parts. First, the hydrogen must diffuse into the pore structure of the electrode and through an aqueous layer covering the catalyst surface. Second, the hydrogen is adsorbed on the metal catalyst and dissociated into water and electrons ( VOLMER-TAFEL mechanism). Third, the reaction water is desorbed into the electrolyte. The potential of the hydrogen electrode can be calculated using the NERNST equation. Useful catalysts for the hydrogen reaction are nickel , palladium and platinum . Silver and mercury are not usable since hydrogen cannot adsorb at its surface. RANEY-Nickel is made of an alloy of nickel and aluminum after the ignoble aluminum has been dissolved with high concentrated KOH at 80–100 °C. The remaining structure has a high porosity and a very high internal surface and is therefore a preferred catalyst. Problems are given by the formation of nickel oxide which hinders the hydrogen oxidation.
Generally, the oxygen reduction needs a high activation energy and high overvoltage, even at very good catalysts like silver and platinum (400 mV at 1 mA cm −2 ). The exchange current density is low, and the open-circuit voltage needs time to equilibrate [ 12 ]. In alkaline solution the reaction is faster than in acid media and costly noble catalysts can be replaced with nickel. During the oxygen reduction at first hydroperoxide is formed which is in the second step dissociated into absorbed oxygen. This unwanted reaction reduces the potential of the oxygen electrode especially at carbon electrodes to 0.22 V. Then, the actual open-circuit voltage of the fuel cell is only 1.05 V. Useful catalysts for the oxygen electrode in alkaline media are: platinum, platinum on carbon, silver, lithium threated nickel oxide and other metal oxides like RuO 2 and IrO 2 [ 12 ]. A very good catalyst called RANEY-Silver is produced in a similar way like RANEY-Nickel by dissolving aluminum from an alloy.
Accordingly, when catalysts are researched not only the chemical element or compound, but also the micro-structure of the metal catalyst must be considered. In a standard textbook of chemistry, the overvoltage of hydrogen and oxygen at different electrode materials are given with the clear result that platinized platinum shows significant lower overvoltage than blank platinum [ 26 ]. In [ 27 ] an electrode treatment for water electrolysis is presented using high-performance pulsed laser processing. Herewith, Ni–Fe catalysts could be produced based on nanosheets coated on thin nickel fibers for the creation of very high active surface area, with the result of significantly reduced overvoltage in alkaline media.
These phenomena at the nano-scale are not yet fully understood today [ 12 ]. More conceivable are the problems of mass transport in the direct surrounding of the catalyst. The reaction kinetics at the catalyst surface is quite fast in comparison to the slow process of diffusion. Since ion-transport is only possible in aqueous solutions, there must always be a thin layer liquid layer on the catalyst. Hydrogen and oxygen must dissolve into the water and then diffuse to the catalyst. This slows down the electrochemical process, especially at higher current densities. Thus, the optimal reaction place should be the thee-phase contact line where gas and the liquid meniscus meets the solid catalyst surface. Here, all reactants have the shortest way and fast supply can be ensured. Very high rates of heat and mass transfer at the three-phase contact line are also known from fundamental boiling research [ 28 ]. Consequently, it should also be the challenge of the electrode design for electrolyzers and fuel cells to create structures with a high number of these reaction placed. In the following Fig. 1 the model of a gas diffusion electrode is given visualizing this attempt.

Structural design and working principle of alkaline gas diffusion electrodes, exemplary at the hydrogen side [ 25 ]
The main part of the electrode consists of a porous structure of catalyst particles (RANEY-Nickel) which are mixed with PTFE to ensure a hydrophobic character and prevent the pores from flooding with liquid electrolyte. The frontside of the electrode (left in Fig. 1 ) is dry and in contact with the gas (here hydrogen). An additional layer of PTFE foil provides good sealing against liquid. The backside of the electrode (right in Fig. 1 ) is in contact with the liquid electrolyte flow in a gap of about 1.5 mm thickness. To prevent total flooding of the electrode it is covered with a hydrophilic separator which feeds only a limited amount of aqueous electrolyte into the catalyst structure. Consequently, a high number of thin liquid films and three phase contact lines at the catalyst surface can be assumed. It is the reason for a generally high electrochemical activity of the electrode. In practical operation the active area can be improved by adjusting the gas pressure which works against the capillary pressure of the liquid menisci in the structure. Thus, the hydrostatic equilibrium can be used to shift the phase boundary within the electrode to improve the wetting of the catalyst particles.
3 Experimental
One objective of the on-hand work is the design of a highly-efficient fuel cell system for the storage of electric energy from renewable sources. To achieve this, an experimental investigation program was developed using two different designs: a reversible alkaline fuel cell with an electrolyte gap and an alkaline membrane electrolyzer with zero-gap design. All the experimental investigations herewith were conducted in the laboratory of fuel cell technology at the FRANKFURT UNIVERSITY OF APPLIED SCIENCES (UAS). The experimental data are being compared with a reversible PEM fuel cell working in fuel cell and electrolyzer mode which was investigated in a former study of the corresponding author at the FRAUNHOFER INSTITUTE OF SOLAR ENERGY SYSTEMS (ISE) in Freiburg, Germany [ 29 ].
For the alkaline technology used in the on-hand work, a test section was developed where hydrogen and oxygen are supplied from an external electrolyzer cell, allowing an over pressure of 4 bar. With a data acquisition system, cell current and voltage, the important temperatures and the gas pressures were recorded.
The two different cell concepts were executed as given below. These designs have been carefully developed to meet the objectives of the research:
Design A: classic AFC with electrolyte gap configuration—see Fig. 3
Design B: pressure electrolyzer with zero-gap configuration—see Fig. 4
The test section testing for combined experiments in electrolyzer and full cell mode is shown in Fig. 2 . For testing the different kind of cells designs small adaptations were made. The test bench is complete build out of stainless steel, and only flour caoutchouc (FKM) sealings and tubes are used to avoid any reaction with the aggressive potassium hydroxide (KOH) even at temperatures above 100 °C [ 30 ].

Test bench for characterizing the alkaline electrolyzer and fuel cell using two different cells designs: figure a zero-gap configuration, figure b electrolyte gap configuration
In both test bench configurations, the same parts are used. The tubing is slightly different. For the zero-gap design no extra tube is needed for the O 2 transport. To use the zero-gap design in fuel cell mode, the electrolyte is removed by chancing the pump direction and feed O 2 instead of KOH into the cell. The electrolyte gap design has an additional tube for O 2 outlet. To change the operation mode of the cell with the electrolyte gap configuration no changes are needed. Switching from fuel cell to electrolyzer mode can be realized in seconds.
For all experiments a gear pump is used to circulate the electrolyte which can feed up to 5 l h −1 . The electrolyte gap design has a higher internal flow resistance leading to a reduced flow rate of 3.6 l h −1 . This value was also used for the zero-gap configuration to get comparable results. Both cell designs are mounted vertically to drive out any gas bubbles due to density differences. These could have a significant influence on the cell performance when active area is blocked by gas accumulations at the membrane or in the electrolyte gap. Therefore, the liquid is pumped from the bottom side to the top to ensure phase separation and a good wetting of the electrodes. The temperature is measured at the inlet and at the outlet of the cell with PT100 temperature sensors. The temperature sensors are fitted with T-connector directly in the electrolyte flow. Experiments with a third PT100 positioned directly in the active area of the cells has shown 5–7 K higher temperature than the inlet temperature. Consequently, the temperature information given in the subsequent diagrams have taken this internal temperature difference into account. For measuring the pressure, manometers with different scales were used. With the help of these pressure gauges and manual pressure control valves, the backpressure of the H 2 and O 2 flow in the cell could be adjusted accurate.
The liquid electrolyte used for all experiments was an aqueous solution of potassium hydroxide (KOH) with a concentration (by weight) in the range of 9 mol l −1 . The concentration was checked frequently with extracted KOH and titration during the different tests. The lowest value was 6 mol l −1 . For tests in fuel cell mode H 2 and pure O 2 are fed from an external electrolyzer direct to the cell without any gas treatment or humidification (Table 1 ).
The two tested alkaline cell designs are shown and described below.
3.1 Reversible Alkaline Fuel Cell (AFC)
First, the design A is described which operates with an electrolyte gap between the electrodes. This design offers the possibility to switch between full cell and electrolyzer mode without any changes by valves or flow direction of the gas or electrolyte. The cell design has been developed at the ENNOBLE POWER Research Laboratory [ 31 ] and optimized at the FRANKFURT UAS. The design is based on traditional alkaline fuel cell of two electrodes separated by a liquid electrolyte [Rashid2015, Phillips2016]. Representative of this cell is a simple structure with cost-effective materials. No milling of metal parts is required. The assembly of the cell is given in Fig. 3 .

Structure of the reversible alkaline fuel cell (AFC) with electrolyte gap
The electrolyte gap in-between the electrodes is a crucial point of the design. The thickness of the gap is defined by a sealing frame (5) including a support structure (6). It must be very thin, to minimize ohmic resistance, also it must ensure a uniform liquid supply without holding gas bubbles inside the structure. The sealing and support structure must be chemically stable against highly concentrated KOH and thermally stable up to 130 °C. To achieve that, the used gasket was cut out of 1 mm to 1.5 mm FKM plates by laser cutting. This results in an electrolyte gap thickness < 1.5 mm. For the support structure (6) several materials and designs were observed for optimization. Meshwork of polypropylene (PP) with different thread diameters and mesh openings were investigated with positive results. (Many thanks to the PVF MESH & SCREEN TECHNOLOGY GmbH Germany, for supporting the team with samples). The end plates (1) are milled out of PP which is easy to process and has electrically insulating characteristics. Included in these endplates are two gaskets (2) and the flow fields for H 2 and O 2 . The inner gasket seals the gas channels to the electrode and outer side one seals the endplate to the nickel frames. The used electrodes (3) are pressed with the nickel mesh on the nickel sheets (4) which are used for electrical contact. The active area of this cell is 36 mm 2 which are defined by the open size of the electrodes and the extract of the nickel sheets. The electrolyte flows from the bottom to the top to ensure proper contact to the electrodes with no air bubbles [ 25 ].
3.2 Alkaline Pressure Electrolyzer (AEM)
The zero-gap design for alkane electrolyzers is based on an early design from the ACTA Company and optimized by the FRANKFURT UAS where it was installed in the laboratory to test different electrodes and membranes. The design is like a PEM electrolyze for achieving high gas quality and enable the possibility to produce pre-compressed hydrogen gas. A schematic drawing is given in Fig. 4 to illustrate the zero-gap working principle (do not scale from this drawing).

Schematic design drawing of the alkaline pressure electrolyzer (AEL) with zero-gap design
Here, the core element is an alkaline membrane (AEM) or separator which ensures the transport of water and hydroxide ions (OH − ). On both sides of this membrane gas diffusion electrodes are pressed with the help of metallic support structures and massive steel endplates. The support structures were produced from differently sized stainless-steel meshworks which are welded together. The respective side facing to the electrode is polished to have a good electric contact. The support structures including electrodes and membrane are enclosed by a synthetic material structure made of polypropylene (PP) and sealed with several gaskets. This AEL cell design reduces significant the ohmic resistance of the cell in contrast to the AFC design with an electrolyte gap of about 1.5 mm thickness.
It can be taken Fig. 4 that the oxygen side of the electrolyzer is flooded with liquid electrolyte while the hydrogen side remains almost dry. This is important in terms of the mass transfer of the electrochemical process. At the hydrogen electrode, the produced gas can easily diffuse into the dry support structure rarely hindered by any liquid. At the oxygen side, gas bubbles must be formed which is an energy consuming process. On the other hand, water splitting takes place at the hydrogen electrode which means that water must diffuse through the membrane against the current of the hydroxide ions. The positive effect of a thin membrane and therewith low electrolyte resistance will be diminished by a negative effect of mass transportation. It is one target of the here presented experimental investigation to evaluate these opposing physical effects using the two different cell designs.
3.3 Electrodes
For all experiments gas diffusion electrodes developed and produced by GASKATEL Company in Germany are used. They are produced with RANEY-Nickel (Ni), polytetrafluoroethylene (PTFE) and a special carbon (C). To ensure the mechanical stability and the electrical conductivity these are integrated on a Nickel mesh. The resulting electrode is the porous structure of Ni, PTFE and Carbon with the thickness of 0.3 mm. The mixing ratio of the three substances can be varied. The hydrogen side mainly an electrode called NiH33 was used made of Ni and PTFE. For the oxygen side, carbon is added to create a bifunctional electrode called NiC. The general structural design of the electrodes is shown in Fig. 1 .
This type of gas diffusion electrode has been developed to achieve a very high number of three-phase-contact lines, where there is the region with very high activity [ 25 , 32 , 33 ]. The electrode has a hydrophobic part and a hydrophilic part. To create the optimum hydrodynamic equilibrium, the electrode could be used in different ways by integrating electrode appropriately. To support the water and KOH transport into the electrode, the electrodes could be treated with a special mixture of the electrolyte side, consisting of polybenzimidazole (PBI), N-Methyl-2-Pyrrolidon (NMP), and titanium oxide. The electrodes could also operate with a foil made of polyester-sulfone (PESU). Both are installed or applied on the Side in the electrolyte gap, where also the nickel mesh is oriented to. To avoid KOH or water in the gas channels on the opposite side of the electrode, a Teflon foil is installed here which is gas permeable but not water permeable. In the electrode itself the different gases and the water must be exchanged while diffusing and feeding liquid through the micro pores from the catalysts. The size of those micro pores depends on the mixture and size of the nickel, PTFE and carbon. The Size of the NiH33 pores are about 5–17 µm. With added carbon, those size shrinks to < 1 µm. It can be taken from scanning electron microscope (SEM) pictures in Fig. 5 .

SEM pictures of the electrode structure: NiC ( a ) and NiH33 ( b ) with 1000 × Zoom
3.4 Measurement Equipment
For all experimental designs current–voltage characteristics were recorded. Therefore, a four-quadrant electronic load (source and sink) from the HÖCHERL & HACKEL Company in Germany was used (model NL1V10C20 Standard). It allows a reliable operation in the potentiostatic mode (constant voltage) in the range from − 1 to 10 V, or in the galvanostatic mode (constant current) in a range from − 20 to + 20 A.
For measuring the impedance of the cells, the Electrochemical Workstation from the ZAHNER Company in Germany was used (model Zennium Pro). It allows a frequency range from 10 μHz to 8 MHz, with a current from − 3 to + 3 A, in a voltage range from − 15 to + 15 V.
4 Results and Discussion
To test the bifunctionality of the electrodes, initially the cell with the electrolyte gap was used for experimentation. The cell was connected to external hydrogen and oxygen supplies while the temperature of the cell was adjusted via the electrolyte flow through the electrodes. To activate the electrodes (which were oxidized in the ambient air) the cell was operated for at least 2 h while a voltage between 850 and 900 mV was achieved using the potentiostatic mode of the electronic load. After this "run-in" period, the cell was slowly stressed with the load. By increasing the voltage, oxygen and hydrogen could be produced in the cell. No other change, apart from the voltage, was necessary to switch from fuel cell mode to electrolysis mode and therewith switch the current from negative to positive flow direction. The open circuit voltage after the first electrolysis measurement settled at about 1.26 V.
As a reference, in several experiments, measurement data from a reversible PEM fuel cell are displayed. These data were recorded in an early study of the corresponding author at the FRAUNHOFER ISE in Freiburg, Germany [ 29 ]. The reference PEM cell was produced from titanium plates and used a NAFION®117 membrane. The catalyst loading at the hydrogen side was 2 mg cm −2 platinum, at the oxygen side a 1:1 mixture of platinum and iridium with also 2 mg cm −2 in total was used. Although todays PEM fuel cells applications are working with much smaller catalyst loadings and with thinner membranes, the used NAFION®117 membrane is still a standard in the fuel cell research and so still present acceptable values for comparing the general differences between acid and alkaline electrolytes.
In Fig. 6 the bifunctional (reversible) behavior of AFC with electrolyte gap and with zero-gap design are compared with the PEM reference. It is obvious that especially in fuel cell mode (negative current) the PEM reference cell shows a much better behavior over a wide range, while the AFC presents only very low current densities. In electrolysis mode, the AFC is more efficient than the PEM reference for up current densities of about 100 mA cm −2 . At higher current densities the PEM reference also shows a better performance. However, it must be mentioned that the AFC works with a low-cost carbon catalyst, while the PEM reference used a high load of costly platinum and iridium catalyst.

Current–voltage characteristics of three different reversible fuel cells over the full operation range. PEM reference with data from [ 29 ]
The alkaline cell with zero-gap design presents no stable behavior in fuel cell mode. This is since the metal support structures were especially optimized for the electrolyzer mode. In fuel cell operation they soak to much liquid into the pores which blocks the gas supply of the electrode. This problem was also observed using the reversible PEM fuel cell with gas diffusion layers produced from titanium foam. Stable operation in fuel cell mode was only possible with conventional hydrophobic carbon fiber layers. Finally, it is a general problem for reversible fuel cells with zero-gap design (membrane technology). The AFC with electrolyte gap has no problem with this since the gas diffusion electrodes works almost perfect in both directions.
4.1 Electrolysis Mode
The electrolysis mode is examined in more detail below. Therefore, an alkaline membrane FAAM20 from the FUMATECH Company in Germany was installed using the zero-gap design. In AFC with electrolyte gap there was no membrane at all, but just thin layer of a hydrophilic mixtures (PBI, NMP and titanium oxide) was brushed at the liquid side of the electrodes. This protects the electrodes from flooding and shows very low resistance for the ion flow.
In Fig. 7 the different electrolyte and membrane assemblies are compared. One could assume that the alkaline membrane with a thickness of only 20 micron has the lowest resistance and consequently shows the best performance. But, as can be seen in Fig. 7 the AFC with a 1.5 mm thick electrolyte gap shows the best performance of all: especially at low current densities of about 50 mA cm −2 the AFC shows much smaller overvoltage than the PEM. With a current density of about 300 mA cm −2 the electrolysis works with a cell voltage around 1.7 V. Here, several positive effects seem to complement each other. First, the very good electrochemical activity in aqueous alkaline solution with nickel catalyst. Second, a very high number of three-phase-contact-lines in the porous structure of the gas diffusion electrode. Third, an optimized oxygen reaction with carbon in combination with Raney-Nickel. Furthermore, the positive effect of high temperatures on the efficiency (shown in the early work of F.T. Bacon) can be exploited when the temperature is increased above 80 °C. This can be realized in the AFC, since there is no sensitive membrane which must be protected against overheating as discussed in [ 34 ]. It works fine at 90 °C and more where the ohmic resistance of the potassium hydroxide is very low. This effect will be researched in more detail in the following.

Current–voltage characteristics in electrolysis mode for comparing three different cell designs: alkaline pressure electrolyzer with zero-gap design and alkaline membrane (FUMATEC, FAAM, 20 μm thickness, RANEY-Nickel and NiC GDEs); reversible AFC with 1.5 mm electrolyte gap (same electrodes); and reversible PEM fuel cell (NAFION®117 membrane, 170 μm thickness, platinum (2 mg cm −2 ) and platinum/iridium catalyst (2 mg cm −2 ) [ 32 ]
Figure 8 shows the impact of the electrolyte temperature using the electrolyte-gap design in electrolyzer mode. With rising temperature, the voltage decreases and so the efficiency is rising. The impact is significant. With an electrolyte temperature of 100 °C the cell could run at 120 mA cm −2 before reaching the thermo-neutral voltage. There are different effects which are leading to this observation. The reaction at the catalysts itself is given by the overvoltage of the cell, at higher temperatures the catalysts works more efficient and presents lower over-voltage for the same current. Also, the electrons need to pass through a layer of water molecules adhering directly at the catalyst surface, which is a temperature dependent process [ 12 ]. Concludingly, this is a remarkable result for the AFC with electrolyte gap. It shows, that for typical current densities of conventional alkaline electrolyzers it is possible to reach electrical efficiencies around 100%. This is promising for the design of highly-efficient energy storage systems with electrolyzers and fuel cells.

Current–voltage characteristics in electrolyzer mode using the AFC with 1.5 mm electrolyte-gap at different temperatures. Gas-diffusion-electrodes: hydrogen: NiH33/oxygen: NiC
On the other hand, electrolyzers with electrolyte gap are difficult to build for higher pressures as need for filling pressure containers with hydrogen. It is important to develop also membrane electrolyzers with high efficiency for this use. But, especially the mechanisms of water transport seem to be more difficult as shown below.
The characteristics of different electrode arrangements using a thin alkaline membrane (FAAM20) with the zero-gap design are given in Fig. 9 . At first the same electrodes were used like obtaining the best results in the AFC with electrolyte gap: a RANEY-Nickel (NiH33) at the hydrogen side and the bifunctional nickel-carbon (NiC) at the oxygen side. But, here it shows a week performance and above 100 mA cm −2 strong problems with mass transportation lead to an upward curve. With RANEY-Nickel electrodes at both sides some improvement could be made. The unexpected but best result with a straight flat curve could be obtained with interchanged electrodes: NiC at the hydrogen side and NiH33 at the oxygen side. This is surprising at first and requires a closer look into the electrochemical phenomena. RANEY-Nickel is generally a quite effective catalyst for both, the hydrogen and the oxygen evolution. The addition of carbon in the bifunctional NiC electrode was especially developed for the fuel cell mode, where it is necessary. In the electrolysis mode it obviously helps not very much for the oxygen evolution. On the other side, the carbon seems to have a positive effect at the hydrogen electrode. This can be explained by the mechanisms of mass transportation. In alkaline electrolyzers the hydroxide ions are produced at the hydrogen electrode while water is consumed. At the oxygen electrode it is the other way around. Consequently, hydroxide ions must diffuse from the hydrogen to the oxygen side while water must diffuse through the membrane and against the ion flow from the oxygen to the hydrogen side. This can lead to a dehydration of the hydrogen electrode. Here, the carbon can help since it better holds the water and has much smaller pores: < 1 μm instead of 10–40 μm at RANEY-Nickel [ 33 ]. Thus, it can be concluded that an improvement of the water management at the hydrogen electrode can be achieved with an additional carbon content. If the carbon electrode is located at oxygen side another effect occurs: the produced oxygen bubbles can settle in the fine pores of the carbon and "clog" them. This poor oxygen removal leads to a reduction of the active area and thus to poorer performance.

Current–voltage characteristics in electrolyzer mode using zero-gap design with FAAM20 and different electrode arrangements at the hydrogen and oxygen side, GDEs: NiH33 and NiC
The effects described above are reflected in the impedance spectroscopy recorded during electrolysis operation (Fig. 10 ). For an improved cell design, the impedance should be low to guaranty a small internal resistance. Additionally, the phase is considered: a flat curve at low frequencies is a sign for optimized mass transport. The best mass transfer takes place in the constellation with the NiC electrode at the hydrogen side and the NiH33 at the oxygen side. Despite the lowest cell resistance with 6 mOhm, the NiH33 electrode at both sides does not offer the best performance, because as described before, the water balance is not optimal for this cell design.

Impedance spectra of the three different electrode arrangements also presented in Fig. 9 . Solid lines: H 2 :NiC/O 2 :NiH33; circle marks: H 2 /O 2 :NiH33; dashed lines: H 2 :NiH33/O 2 :NiC
It is important to note that these observations and values are only valid for the water deficit network with the Membrane FAAM-20 used here and other membranes may require a different water management. To obtain comparable results, the FAAM-Membrane was watered for at least 24 h before installation and then run in together with the electrodes at a fixed current of 1.7 V for 48 h.
4.2 Fuel Cell Mode
It was shown above that the alkaline fuel cell operation with an electrolyte gap shows a fundamentally weaker performance then the PEM fuel cell. With the bifunctional NiC catalyst only about 50 mA cm −2 could be realized, although the electrolyte temperature was set between 85 and 90 °C. The gas diffusion electrodes were supplied with pure oxygen and hydrogen at little overpressure of about 200 mbar from an external PEM electrolyzer. It could be figured out that the hydrostatic equilibrium between liquid electrolyte, capillary pressure and gas pressure is very sensitive to adjust but has a big impact on the performance. Probably, only a small part of the catalyst surface is in effective operation. Increasing gas pressure lead to some improvement with the risk that gas bubbles break through the electrode structure and block the electrolyte supply. The electrolyte feeding into the structure from the gap is also important. If no hydrophilic layer is applied the electrode will be flooded after a while with strongly decreasing performance. With a thin layer of a hydrophilic mixtures (PBI, NMP and titanium oxide) brushed at the liquid side of the electrodes some improvement could be obtained but with hardly stable operation in small pressure range. A more stable operation could be achieved with PESU separators, with tiny pores of approximately 0.1 µm size [ 33 ], pressed on both electrodes using the support structure in the electrolyte gap.
In Fig. 11 different electrodes and hydrophobic layers are investigated using the AFC in fuel cell mode. The first experiments were conducted with a NiH33 electrode at the hydrogen side and NiC electrodes at the oxygen side. Using the PSU separators results in a characteristic with the lowest performance. Additional impedance measurements showed that the internal cell resistance with 2 separators is quite high and lays in a range of about 40 mOhm. With the same electrode configuration and a brush applied separating layer of PBI, NMP and titanium oxide, the efficiency increases. This increase in performance is due to lower internal resistance of the cell and improved water transport. The three-phase boundary can be shifted by carefully varying the pressure and thus influence the performance.

Comparison of AFC with electrolyte gap with different oxygen electrodes (NiC, NiX and RANEY-Silver) all with NiH33 at hydrogen side, compared with PEM reference cell [ 29 ]
Additionally, another carbon electrode (NiX) was investigated, which is a NiC with a modified mixture. It benefits enormously from pressure and shows that the electrodes still offer further potential by optimizing the operating pressure and the chemical composition. The NiX electrode contains 5% more carbon what equals to an increase of 25% more volume and surface than the reference NiC. Finally, a high-performance silver electrode was installed which was made from a mixture of RANEY-Silver and PTFE. Very good improvement and much better performance could be obtained with the use of this electrode. At low current densities up to 100 mA cm −2 it performs with clear higher voltage than the PEM reference fuel cell. However, silver is costly and does not allow reversible operation since it will dissolve at higher voltages during electrolysis. But against the background of the development of highly-efficient energy storage with fuel cells silver must be considered as an alternative catalyst: in alkaline media with silver catalyst the highest efficiencies of all fuel cells can be achieved.
4.3 Storage Efficiencies
Concludingly, the measured cell voltages can be used to present the electrical efficiencies of the researched cell types in fuel cell and electrolyzer mode. From that the round-trip efficiency for storing electric energy can be displayed. The PEM fuel cell shows much better performance at high current densities. But, since it was the objective of the on-hand work to discuss the potential of the alkaline technology, small current densities are considered here. In the following table the efficiencies of the AFC with electrolyte gap are compared with the data of the reversible PEM fuel cell from [ 29 ] at current densities of 50 mA cm −2. (Table 2 ).
Both fuel cells are working at quite high efficiencies. But, at low current density the alkaline technology can play to its advantage. While the PEM system reaches around 55% round-trip efficiency, the AFC obtains 65%. It is remarkable since this range is comparable with conventional lead-acid batteries. Finally, the alkaline fuel cell technology has the potential for designing highly-efficient hydrogen storage systems as an alternative to batteries. On the other hand, the current densities are to low for technical use. There is still a need for research in this field.
5 Summary and Conclusion
The first investigations of the bifunctional electrodes show that these have significant potential to increase the efficiency at low cost for electrolysis process. The results with the gap design are particularly good, since a high efficiency of 300 mA cm −2 at cell voltage < 1.7 V has been achieved and the cell can also be used as a fuel cell without any modifications. Also, in the zero-gap design where the electrodes are in direct contact with the membrane, the bifunctional electrodes bring advantages as they can be used to optimize the water balance. Comparing the roundtrip efficiency with the values of a reversible PEM-Cell, especially in electrolysis mode at low densities, work can be done much more efficiently. Particularly noteworthy are the values under the thermoneutral voltage. At 95 °C in the cell, up to 100 mA cm −2 can be achieved at less than 1.47 V and thus an electrical efficiency of 100%. This does not include the required heating and pumping power. In fuel cell operation, however, the alkaline fuel cell can only compete with silver at low current densities of the PEM-Cell. Future work is in operation to achieve even more Power with the same area and less voltage. Therefore, the electrodes will be optimized resulting in more active area and less resistance. Additionally, the long-term stability of the NIC should be investigated, also because in [ 25 ] only 60 h operation were observed.
It should be emphasized that very good roundtrip efficiencies about 65% could be achieved with the AFC. These are comparable with lead-acid batteries. This is promising for the design of highly-efficient fuel cell storage systems as an alternative to batteries. However, the current densities are still too low. With the optimization of thin alkaline membrans the power density will be improved. Although silver catalyst is not suitable for a bifunctional operation, it achieves the highest fuel cell voltages of all and should be considered for future research. To save the costly silver catalyst it could be supported on carbon particles and directly coated on alkaline membranes.
IPCC, Sixth Assessment Report (2021) www.ipcc.ch/assessment-report/ar6/
EATON (2021) Fit für die Zukunft: Stromnetz braucht flexible, zellulare Struktur, Solarserver at 30th September 2021, www.solarserver.de
Kurzweil P, Dietlmeier OK (2015) Elektrochemische Speicher. Springer Vieweg, Wiesbaden
Book Google Scholar
Chen W, Liang J, Yang Z, Li G (2019) Energy Procedia 158:4363–4368
Article Google Scholar
Thomas LV, Schmidt O, Ajay G, Sheridan F, Iain S (2020) J Energy Storage 28:101230
Sternberg A, Hank C, Hebling C (2019) Treibhausgas-Emissionen für Batterie- und Brennstoffzellen-fahrzeuge mit Reichweiten über 300 km, Fraunhofer ISE
Kneer A, Jankovic J, Susac D, Putz A, Wagner N, Sabharwal M, Secanell M (2018) J Electrochem Soc 165(6):F3241–F3250
Article CAS Google Scholar
Napporn TW, Mokrini A, Rodríguez-Varela FJ (2018) Advanced electrocatalysts for low-temperature fuel cells. Springer, Cham
Google Scholar
Osman AI, Mehta N, Elgarahy AM, Hefny M, Al-Hinai A, Al-Muhtaseb AH, Rooney DW (2022) Hydrogen production, storage, utilisation and environmental impacts: a review. Environ Chem Lett 20:153–188. https://doi.org/10.1007/s10311-021-01322-8
Scheepers F, Stähler M, Stähler A, Rauls E, Müller M, Carmo M, Lehnert W (2021) Appl Energy 283:116270
Bacon FT (1969) Fuel cells past, present and future. Electrochem Acta 14:569–585
Kurzweil P (2016) Brennstoffzellentechnik. Springer Vieweg, Wiesbaden
Ledjeff K (1995) Brennstoffzellen. C.F. Müller, Heidelberg
Xue J, Zhang J, Liu X, Huang T, Jiang H, Yin Y, Qin Y, Guiver MD (2022) Toward alkaline-stable anion exchange membranes in fuel cells: cycloaliphatic quaternary ammonium-based anion conductors. Electrochem Energy Rev 5:348–400. https://doi.org/10.1007/s41918-021-00105-7
Park S, Shao Y, Liu J, Wang Y (2021) Energy Environ Sci 11:9331
Ferriday TB, Middleton PH (2021) Alkaline fuel cell technology: a review. Int J Hydrogen 46:18489–18510
Desmond JW, Gorlin Ng Y, Hatsukade T, Jaramillo TF (2013) Adv Energy Mater 3:1545
Wagner N, Schulze M, Gülzow E (2004) J Power Sources 127:264
Gamburzev S, Petrov K, Appleby AJ (2002) J Appl Electrochem 32:805
Franzen D, Ellendrof B, Paulisch MC, Hilger A, Osenberg M, Manke I, Turek T (2019) J Appl Electrochem 49:705
Gülzow E, Wagner N, Schulze M (2003) Fuel Cells 3(1–2):67–72
Yong WF, Chung T-S, Weber M, Maletzko C (2018) New polyethersulfone (PESU) hollow fiber membranes for CO 2 capture. J Membr Sci 552:305–314. https://doi.org/10.1016/j.memsci.2018.02.008
Pan ZF, Zhao TS, Tang ZK (2018) Prog Energy Combust Sci 66:141
Hodges A, Hoang AL, Tsekouras G, Wagner K, Lee C-Y, Swiegers GF, Wallace GG (2022) A high-performance capillary-fed electrolysis cell promises more cost-competitive renewable hydrogen. Nat Commun 13:1304. https://doi.org/10.1038/s41467-022-28953-x
Article CAS PubMed PubMed Central Google Scholar
Wagner E, Kohnke HJ (2020) Another chance for classic AFCs? Experimental investigation of a cost-efficient unitized regenerative alkaline fuel cell, using platinum-free gas diffusion electrodes. Fuel Cells 20(6):718–729
Dehnert K, Jäckel M, Oehr H, Rehbein U, Seitz H (1979) Allgemeine Chemie, Schroedel
Forsythe RC, Cox CP, Wilsey MK, Mueller AM (2021) Pulsed laser in liquids made nanomaterials for catalysis. Chem Rev 121:7568–7637
Article CAS PubMed Google Scholar
Wagner E, Stephan P (2009) High resolution measurement at nucleate boiling of pure FC-84 and FC-3284 and its binary mixtures. ASME J Heat Transfer 131(12):1–12
Wittstadt U, Wagner E, Jungmann T (2005) J Power Source 145:555–562
Ilseng A, Skallerud BH, Clausen AH (2016) Tension behavior of HNBR and FKM elastomers for a wide range of temperatures. Polym Test 49:128–136
Wagner E (2019) Fuel cell module. German Utility Patent DE202019001642.2
Chaudhari NK, Jin H, Kim B, Lee K (2017) Nanostructured materials on 3D nickel foam as electrocatalysts for water splitting. Nanoscale 9:12231–12247
Kohnke H-J (2006) Proceedings of ACHEMA, Frankfurt
Liu Z, Syed Sajjad SD, Gao Y, Yang H, Kaczur JJ, Masel RI (2017) The effect of membrane on an alkaline water electrolyzer. Int J Hydrogen Energy 42(50):29661–29665
Download references
Acknowledgements
The experimental investigation of the on-hand word was performed in the new fuel cell laboratory of the FRANKFURT UAS. Many thanks to the head of the FACULTY OF COMPUTER SCIENCE AND ENGINEERING for equipping the laboratory with high-quality devices. Special thank goes to the STATE OF HESSE for the funding program for universities of applied sciences with the title Research for practice . With this founding the doctoral student Erik Delp was paid for one year. Many thanks also to the master student Lennard Winter who improved the AFC design and who recorded many characteristics, partially presented in the on-hand work.
Open Access funding enabled and organized by Projekt DEAL.
Author information
Authors and affiliations.
Frankfurt University of Applied Sciences, Frankfurt, Germany
Enno Wagner & Erik Delp
School of Computing and Engineering, University of Huddersfield, Huddersfield, UK
Rakesh Mishra
You can also search for this author in PubMed Google Scholar
Corresponding author
Correspondence to Enno Wagner .
Additional information
Publisher's note.
Springer Nature remains neutral with regard to jurisdictional claims in published maps and institutional affiliations.
Rights and permissions
Open Access This article is licensed under a Creative Commons Attribution 4.0 International License, which permits use, sharing, adaptation, distribution and reproduction in any medium or format, as long as you give appropriate credit to the original author(s) and the source, provide a link to the Creative Commons licence, and indicate if changes were made. The images or other third party material in this article are included in the article's Creative Commons licence, unless indicated otherwise in a credit line to the material. If material is not included in the article's Creative Commons licence and your intended use is not permitted by statutory regulation or exceeds the permitted use, you will need to obtain permission directly from the copyright holder. To view a copy of this licence, visit http://creativecommons.org/licenses/by/4.0/ .
Reprints and permissions
About this article
Wagner, E., Delp, E. & Mishra, R. Energy Storage with Highly-Efficient Electrolysis and Fuel Cells: Experimental Evaluation of Bifunctional Catalyst Structures. Top Catal 66 , 546–559 (2023). https://doi.org/10.1007/s11244-022-01771-7
Download citation
Accepted : 12 December 2022
Published : 13 January 2023
Issue Date : March 2023
DOI : https://doi.org/10.1007/s11244-022-01771-7
Share this article
Anyone you share the following link with will be able to read this content:
Sorry, a shareable link is not currently available for this article.
Provided by the Springer Nature SharedIt content-sharing initiative
- Bifunctional catalyst
- Gas diffusion electrodes
- Electrolyte
- Alkaline membranes
- Nickel-graphite catalyst
- Find a journal
- Publish with us
- Track your research
Hydrogen or batteries for grid storage? A net energy analysis †
Matthew A. Pellow * a , Christopher J. M. Emmott bc , Charles J. Barnhart d and Sally M. Benson aef a Global Climate and Energy Project, Stanford University, Stanford, CA 94305, USA. E-mail: [email protected] b Department of Physics, Imperial College London, London, SW7 2AZ, UK c Grantham Institute for Climate Change, Imperial College London, London, SW7 2AZ, UK d Institute for Energy Studies, Western Washington University, Bellingham, WA 98225, USA e Department of Energy Resources Engineering, Stanford University, Stanford, CA 94305, USA f Precourt Institute for Energy, Stanford University, Stanford, CA 94305, USA
First published on 8th April 2015
1 Introduction
Another technology available for grid-scale energy storage is a regenerative fuel cell, in which energy is stored as hydrogen gas. 11–13 A regenerative hydrogen fuel cell system consists of a water electrolyzer, compressed hydrogen gas storage tanks, and a fuel cell ( Fig. 1 ). The system uses electricity to generate hydrogen from water in an electrolyzer. The hydrogen is stored in high-pressure tanks, and dispatched to the hydrogen fuel cell to generate electricity when desired.
Regenerative hydrogen fuel cells (RHFC's) have several characteristics that are well-suited to large-scale energy storage. They are not subject to geological requirements, which are important restrictions on pumped hydro and compressed air storage. The energy capacity and power capacity of a regenerative fuel cell can be configured independently. Storing energy in hydrogen provides a dramatically higher energy density than any other energy storage medium. 8,10 Hydrogen is also a flexible energy storage medium which can be used in stationary fuel cells (electricity only or combined heat and power), 12,14 internal combustion engines, 12,15,16 or fuel cell vehicles. 17–20 Hydrogen storage has a very low rate of self-discharge, and has therefore been proposed for seasonal storage. 8,21 The cost of energy storage in a regenerative hydrogen fuel cell is already potentially competitive with batteries in an optimized energy arbitrage system. 22 Several dozen RHFC projects have already implemented hydrogen storage, spanning a wide range of energy and power capacities ( Fig. 2 ). 12 The most common configuration among existing systems contains an alkaline water electrolyzer (AWE) and a polymer electrolyte membrane fuel cell (PEMFC). ‡
In the present study, we use net energy analysis to compare regenerative hydrogen fuel cells to other storage technologies on the basis of life-cycle energy costs. We first introduce a model to determine the ESOI e ratio of a RHFC system as a function of system parameters such as fuel cell efficiency and energy-to-power ratio. We apply this model to a RHFC system containing an alkaline water electrolyzer and a PEM fuel cell, and analyze the impact of different technology and design variables on the system's lifetime energy balance. We then use the model to analyze the energy cost or benefit that results from building new RHFC storage to complement an intermittent renewable generating facility. Finally, we compare it with a lithium ion battery storage system, which has the highest ESOI e ratio among the battery technologies currently used for grid-scale storage.
2 Methodology
2.1 esoi e ratio of a regenerative hydrogen fuel cell, 2.2 reference case values.
To determine the energy intensity of alkaline water electrolyzers (AWE's), life cycle inventory (LCI) data are required. Unfortunately, no peer-reviewed LCI's are available for alkaline water electrolyzers. However, an empirical LCI is available for an alkaline fuel cell (AFC), a 2010 study by Staffell and Ingram (Table S1, ESI † ). 39 Although AWE's and AFC's are designed differently, both employ nickel as a catalyst, at the anode of an AFC and the cathode of an AWE. 27,39–41 We judge that because of the partial overlap in this key energy-intense material, the AFC LCI provides a useful approximation when estimating the embodied energy of the AWE. From this life-cycle inventory and Ecoinvent data, 42 we determined a final value of 1.36 × 10 6 (MJ) prim /(MW) el for the cell stack of the alkaline fuel cell model analyzed by Staffell and Ingram. To convert from primary to electrical energy, we multiply by η grid = 0.30 to obtain a final value of ζ lyz,stack = 4.1 × 10 5 (MJ) el /(MW) el .
This approach necessarily introduces significant uncertainty into our estimate of ζ lyz,stack , and we examine a wide range of values in our sensitivity analysis (Section 3.2).
To determine the energy intensity of a hydrogen compressor, we consider a representative commercially available compressor (RIX Industries model 4VX-S). 43 This compressor has a capacity of 48 N m 3 h −1 (30 SCFM), which is approximately the output of a 240 kW electrolyzer, and weighs 1300 kg (3000 pounds). Since the compressor is fabricated predominantly of steel, we approximate its materials inventory as 100% steel. Using an embodied energy value for steel of 40.0 (MJ) prim kg −1 , 33 this corresponds to an embodied energy of 5.5 × 10 4 (MJ) prim . As the electrolyzer power capacity determines the hydrogen flow rate, which in turn determines the capacity required of the compressor, we normalize the energy intensity of the compressor to the power capacity of the electrolyzer. For the compressor described here, this gives an energy intensity of 2.3 × 10 5 (MJ) prim /(MW) el , or ζ comp = 6.5 × 10 4 (MJ) el /(MW) el .
To estimate the energy intensity of compressed hydrogen storage, we considered a 58 kg steel cylinder that holds 0.72 kg of hydrogen at 20 MPa. 32 To restate this mass of steel in terms of energy, we use the same value for the energy intensity of steel as the previous calculation – 40.0 (MJ) prim kg −1 – and assume that the tank is made entirely of steel. To restate this mass of hydrogen as a quantity of energy, we consider the energy content of hydrogen of 120.2 MJ kg −1 (LHV basis). The steel cylinder described here then has an energy intensity for hydrogen storage of 26.8 (MJ) prim /(MJ) LHV . We multiply by η grid = 0.30 to obtain a final value of ε st = 8.0 (MJ) el /(MJ) LHV .
2.3 ESOI e ratios of batteries and geological storage
3.1 esoi e ratio of a regenerative hydrogen fuel cell.
A RHFC energy storage facility with these technical characteristics and configuration has an ESOI e ratio of 59 (from eqn (9) ). This is higher than lithium ion batteries (ESOI e = 35), and much lower than pumped hydro (ESOI e = 830) and compressed air/natural gas (ESOI e = 1100).
3.2 ESOI e sensitivity analysis
The energy-to-power ratio R also strongly affects the system's net energy performance. This parameter is directly proportional to the discharge time of the fully-charged RHFC, a key operational consideration for energy storage facilities. The discharge time is given by R × η FC . The net energy benefit of a RHFC system is maximized with an R value under 1 × 10 4.5 s (8.8 h, providing up to 4 h of dispatchable power from the fully charged state with η FC = 0.47). However, the ESOI e ratio diminishes dramatically as R increases beyond this value ( Fig. 3 ).
The ESOI e ratio is moderately sensitive to the energy intensity of the compressed hydrogen storage, the energy intensity of the electrolyzer balance of system, and the efficiency of the electrolyzer. The energy intensity of the electrolyzer stack, whose value is the most uncertain among all the technical parameters (Section 2.2.1), is also a moderately sensitive parameter. The energy intensity of the fuel cell balance of system has almost no influence on the ESOI e ratio.
The energy-to-power ratio R has an important interaction with the technical performance parameters such as lifetime and energy intensity of the fuel cell. At small values of R , technology advances such as improvements in fuel cell lifetime and efficiency can significantly increase the ESOI e ratio of the RHFC system. However, larger values of R (providing longer dispatch duration from a single charge) diminish the impact of technology improvements on the ESOI e ratio ( Fig. 4 ).
3.3 Net energy analysis of hydrogen storage versus curtailment for renewables overgeneration
We consider a generating facility that experiences overgeneration, and we wish to determine whether installing energy storage will provide a net energy benefit over curtailment. The generating facility itself has an energy return on investment of [EROI] gen . Due to overgeneration, a fraction ϕ of the generated power must be diverted away from transmission. This diverted power may be stored for later use, or curtailed and lost ( Fig. 5 ).
Both [EROI] curt and [EROI] grid are always less than [EROI] gen . However, [EROI] grid may be greater or less than [EROI] curt , depending on the characteristics of the storage technology used. The choice of whether to build storage or accept curtailment therefore depends on the ESOI e ratio, as well as on the efficiency of the storage facility, the EROI of the generation technology, and the expected diversion ratio ϕ ( eqn (24) ).
When this quantity is positive, building new energy storage capacity will yield a greater overall return on the energy invested in building the entire grid. When this quantity is negative, curtailing the overgeneration will yield a greater overall return on the energy investment, because the energy cost of building the storage facility outweighs the benefit of storing the energy for deferred use.
Because [EROI] grid is a function of the ESOI e ratio, and the ESOI e ratio of a RHFC system is in turn a function of the energy-to-power ratio R , the relative benefit of storing overgeneration in a RHFC system depends on the energy-to-power ratio of the RHFC system ( Fig. 6 ).
For RHFC systems with low values of R , storing overgeneration from a photovoltaic system provides a net energy benefit over curtailing when the diversion ratio is above approximately 10%. At R values above 100 h (providing 47 h of continuous dispatch in our reference system), RHFC storage becomes breakeven at intermediate diversion ratios, yielding neither an energy cost nor an energy benefit compared to curtailment. However, for power from wind farms, RHFC storage is unfavorable except at high diversion ratios ( ϕ > 0.75).
Barnhart et al. recently examined the net energy impacts of building storage versus accepting curtailment for a variety of geologic and battery storage technologies coupled with wind turbines and photovoltaic panels. 24 These included pumped hydro (PHS) and compressed air (CAES) as well as lithium ion (LIB), sodium sulfur (NaS), vanadium (VRB), zinc bromine (ZnBr), and lead acid (PbA) batteries. Here, we extend this analysis with the corresponding results for a RHFC system ( Fig. 7 ). The RHFC system analyzed for this comparison is identical to the reference system ( Table 1 ) except that it contains 22 MW h (8.0 × 10 4 MJ) of hydrogen storage capacity, which provides four hours of discharge ( R = 8.5 h). The maximum dispatch time assumed in this analysis varies for each technology, and is specified in the legend of Fig. 7 . ¶¶
For wind overgeneration, building the reference case RHFC system results in a [EROI] grid equal to the corresponding result for a building a LIB storage system, and more favorable than for other battery technologies. However, the [EROI] grid for any non-geological storage option is lower than [EROI] curt for ϕ < 0.50. In contrast, for photovolatic overgeneration, RHFC storage is less favorable than LIB or NaS, but preferable to curtailing.
4 Discussion
4.1 comparison of rhfc and lib energy storage systems.
Lithium ion batteries (LIB's) have the highest ESOI e ratio (35) among a series of battery technologies being installed for grid storage ( Fig. 8 ). 46 Energy storage in hydrogen, using the reference case RHFC system, has a ESOI e ratio of 59. This indicates that one joule of energy invested in manufacturing a RHFC system enables more output from energy storage than a joule invested in manufacturing a LIB system.
The value of η * for a storage system is strongly influenced by the system's round-trip efficiency, rather than by its materials requirements. Because E life out < E life in , η * always lies between zero and unity. For the RHFC system, the embodied energy is negligible compared to the energy inputs during operation, so η * for the RHFC system is approximately equal to its round-trip efficiency of 0.30. For the LIB, the embodied energy is small compared to the energy inputs during operation, but is not negligible, so the LIB's η * of 0.83 is close to, but slightly lower than, its round-trip efficiency of 0.9.
These two different energy return ratios quantify two different dimensions of energy performance. The higher ESOI e ratio of the reference case RHFC system reflects its more efficient use of manufacturing energy to dispatch the same unit of electrical energy from storage. The LIB's higher overall energy efficiency ( η *) reflects its greater efficiency in handling the energy stored in the system during its operational life.
Although a longer PEMFC stack lifetime increases the ESOI e ratio, it has no effect on the overall energy efficiency of the system. This is because over the lifetime of the system, almost all the energy costs are due to efficiency losses, not to manufacturing the system ( Table 5 ).
Lithium ion batteries contain several materials that are directly involved in storing electric charge: a lithium intercalation compound at the cathode, highly reduced carbon at the anode, a lithium electrolyte, and a separator membrane. ††† These four active charge-storing materials in a lithium ion battery account for approximately 40% of the energy required to manufacture the battery (Table S6, ESI † ). 49,50
In a RHFC system using conventional cylinders to store compressed hydrogen gas, the only material directly involved in storing energy is the steel used to fabricate the cylinders. In our reference case RHFC system, the energy-storing material – the steel pressure vessel – accounts for only 26% of the embodied energy (Table S3, ESI † ). In an otherwise identical RHFC system that uses composite cylinders for hydrogen storage (instead of more energy intensive steel cylinders), the storage component represents only 12% of the system's embodied energy. The materials that perform the intrinsic energy storage function in a LIB system are more energetically expensive than in an RHFC system, as a share of the total manufacturing energy costs.
This contrast is reflected by the different energy intensities of storing energy in compressed hydrogen storage versus lithium ion batteries. Estimates for the energy intensity of lithium ion battery storage range from 86 to 200 MJ MJ −1 . 47,49 This is several times our estimate of 28 MJ MJ −1 for compressed hydrogen storage in steel vessels.
4.2 Key technical parameters and implications for research
The energy intensity of the fuel cell is a moderately sensitive parameter ( Fig. 3 ). Although the fuel cell energy intensity (2.1 × 10 5 MJ MW −1 ) is less than our estimate of the electrolyzer energy intensity (5.1 × 10 5 MJ MW −1 ), the short cell stack lifetime requires seven replacements of the fuel cell stack during the service lifetime of the RHFC system. Since the energy cost of the cell stack must be paid every time the stack is replaced, the fuel cell energy intensity is a higher-sensitivity parameter than the electrolyzer energy intensity, even though its absolute value is lower (1.7 × 10 5 vs. 4.1 × 10 5 MJ MW −1 ). The fuel cell energy intensity is dominated by the energy cost of the platinum catalyst (40%) and carbon fiber (29%), followed by carbon paper (13%) and aluminum (12%) (Table S3, ESI † ).
The significant research effort focused on reducing PEMFC catalyst loadings, 28,51 motivated primarily by cost considerations, is consistent with increasing the ESOI e ratio of a PEMFC-based RHFC system, since lower platinum loadings will reduce the energy intensity of the cell stack. However, because platinum accounts for less than half of the fuel cell's embodied energy (Table S3, ESI † ), reduced platinum loadings will have only a modest impact on the ESOI e ratio of a AWE–PEMFC RHFC system. A 50% decrease in platinum loading yields only a 20% decrease in the fuel cell embodied energy, increasing the ESOI e ratio from 59 to 64.
Another relevant parameter is the energy intensity of the storage vessel. Our reference case RHFC system uses steel cylinders to store compressed hydrogen. However, lower energy intensities have been reported for compressed hydrogen storage in vessels made of aluminum (6.9 MJ MJ −1 ) 52 or reinforced epoxy (3.3 MJ MJ −1 ). 53 Switching from a steel vessel to reinforced epoxy increases the system's ESOI e ratio from 59 to 69 ( Table 4 ).
4.3 Energy-to-power ratio and implications for seasonal storage
For instance, our reference case system, with an ESOI e ratio of 59, can store the energy from up to three days of overgeneration, providing up to 15 hours of continuous power. However, increasing the storage capacity to 90 h (for instance, to enhance load shifting capacity) would reduce the ESOI e ratio to 26. (On the other hand, if the storage capacity is reduced to only one day of overgeneration, the system ESOI e ratio would increase modestly to 69.)
Hydrogen storage has been proposed for seasonal energy storage to mitigate the seasonal variation in wind and solar generation. 8,21 A seasonal storage facility designed to store several months of generation would require a large energy-to-power ratio. When our reference scenario is modified to provide enough storage (in steel cylinders) for 120 days of generation, the energy cost of the increased storage capacity drives the ESOI e ratio down to 4.0.
This result shows that in order to provide a net energy benefit, a seasonal-scale RHFC system must use an alternative method for hydrogen storage. One possibility is underground salt caverns, as described by Crotogino et al. 54 and modeled by Maton et al. 55 We estimate an energy intensity of 3.0 × 10 −7 MJ MJ −1 for storing hydrogen in subsurface caverns, ‡‡‡ compared to 28 MJ MJ −1 for steel cylinders. This would result in an ESOI e ratio of 78 for a seasonal storage system, §§§ much more favorable than using above-ground hydrogen storage for seasonal load shifting. (However, this approach would constrain seasonal hydrogen storage to geologically suitable areas with nearby subsurface salt formations.)
Another possible approach is above-ground storage in large spherical pressurized tanks. Because of the smaller surface-area-to-volume ratio of large spheres, this storage geometry would use less steel to store the same volume of gas, leading to a lower energy intensity of storage.
4.4 To store or curtail: RHFC's and storage technology alternatives
Constructing a new, dedicated RHFC system with a low energy-to-power ratio (less than 100 h) to store photovoltaic overgeneration provides a small net energy benefit ( Fig. 6 ). The RHFC system has a low round-trip efficiency, which tends to make it less energetically favorable. However, this is offset by the low EROI of photovoltaic power (EROI = 8) – that is, it is energetically expensive to produce photovoltaic generating capacity (largely due to energy-intensive silicon refining). 46 Because more energy was invested to provide each kilowatt-hour of photovoltaic electricity, a photovoltaic-powered system can tolerate a lower storage efficiency and still realize a net energy benefit, when the storage capacity is efficiently utilized to capture overgeneration. However, the low round-trip efficiency of the RHFC system makes it a less favorable choice than lithium-ion (LIB) and sodium sulfur (NaS) batteries ( Fig. 7 ). These battery technologies have lower ESOI e ratios ( Fig. 8 ) but much higher round-trip efficiencies (90% for lithium ion; 80% for NaS 56 ). (Pumped hydro and CAES storage are also more favorable than curtailment, but these storage options are site-limited.) It is preferable to store photovoltaic overgeneration in a RHFC system than to curtail, but it is even more preferable to store it in lithium ion or sodium sulfur batteries.
In contrast, constructing new, dedicated RHFC storage is generally unfavorable for wind overgeneration ( Fig. 6 ): it is energetically preferable to simply curtail the wind overgeneration than to spend additional energy to build RHFC storage capacity. For wind power, at low diversion ratios ( ϕ < 0.3), the net energy impact of RHFC storage is similar to that of LIB storage ( Fig. 7 ), even though LIB systems have a much higher round-trip efficiency.
It is noteworthy that even when the EROI of wind-generated electricity is reduced to [EROI] grid by storage in a hydrogen or LIB system, the resulting [EROI] grid is still higher than the EROI of fossil-generated electricity. For instance, if 25% of the output of a wind farm is diverted through the reference case RHFC system, the aggregate to [EROI] grid of the storage-equipped wind farm is approximately 50 ( Fig. 7 ). (The result is the same if LIB is used to store the same fraction of output.) In contrast, combusting coal or natural gas provides electricity with an EROI of approximately 30. 57,58
Net energy analysis describes the energy balance of these technologies, but it does not by itself guide or predict investment in one technology option over another. Technology cost and market structure are important considerations for modeling investment in or deployment of different technology options, and have been discussed elsewhere. 59–66
4.5 Future work
The present analysis makes the simplifying assumption that the electrolyzer and fuel cell operate at 100% of rated power. However, a more detailed model allowing variable operating power would more closely reflect actual systems, and could be coupled with overgeneration time series data to determine ESOI e ratios for RHFC operation under detailed variable-output scenarios.
While consideration of resource constraints is beyond the scope of the present analysis, the availability of platinum (or other precious metals) may impose a practical limit on the pace of installation of PEMFC-containing RHFC systems.
The AWE-PEMFC configuration examined in this analysis is only one of several possible technology configurations for implementing hydrogen storage in a RHFC system. PEMWE-PEMFC and AWE-ICE hydrogen storage systems are already in operation ( Fig. 2 ). In addition, solid oxide electrolyzers and solid oxide fuel cells are a maturing technology class that may become attractive for use in RHFC systems. Further analysis is underway in our group to examine the net energy balance of these additional hydrogen storage technology configurations.
Finally, although the present analysis is restricted to systems that use hydrogen exclusively to produce electricity, there are several other possible uses for stored hydrogen. These include filling fuel cell vehicles, enriching the natural gas distribution system, local industrial consumption, and production of synthetic fuels. A flexible supply installation that can dispense hydrogen to multiple end uses may achieve a better net energy outcome than any single-use configuration. Net energy analysis of these other applications of grid-generated hydrogen, and of optimized flexible use, remains for future work.
5 Conclusion
We find that the reference case RHFC system has a higher ESOI e ratio than lithium ion battery storage. This indicates that the hydrogen storage system makes more efficient use of manufacturing energy inputs to provide energy storage. One reason for this is that the steel used to fabricate a compressed hydrogen storage cylinder is less energetically costly, per unit of stored energy, than the materials that store electric charge in a battery (electrode paste, electrolyte, and separator). However, lithium ion batteries remain energetically preferable when considering the operation of the system, as well as its manufacture, due to their higher round-trip efficiency (90%). This is reflected in the overall energy efficiencies of the two storage technologies: the overall energy efficiency of a typical lithium ion battery system is 0.83, compared to 0.30 for the reference case RHFC system. This highlights that in spite of its relatively efficient use of manufacturing energy inputs, the round-trip efficiency of a RHFC system must increase before it can provide the same total energy benefit as other storage technologies. Higher RHFC round-trip efficiency relies on improved electrolyzer and fuel cell performance.
When storing overgeneration from wind turbines, energy storage in hydrogen provides an energy return similar to batteries, in spite of its lower round-trip efficiency. The aggregate EROI of wind generation augmented with RHFC storage is equal to that of the same wind facility augmented with lithium ion battery storage, when up to 25% of the electricity output passes through the storage system. For spilled power from solar photovoltaics, storage in hydrogen provides an EROI that is slightly higher than curtailment, though lower than batteries. As with other storage technologies, energy storage in hydrogen coupled to wind generation provides an overall EROI that is well above the EROI of fossil electricity generation.
Nomenclature
Abbreviations, acknowledgements.
- International Energy Agency, IEA Statistics: Renewables Information, OECD/IEA, 2014.
- U.S. Energy Information Administration, International Energy Statistics: Renewables Electricity Generation, http://www.eia.gov/countries/data.cfm.
- M. Fischedik, R. Schaeffer, A. Adedoyin, M. Akai, T. Bruckner, L. Clarke, V. Krey, I. Savolainen, S. Teske, D. Urge-Vorsatz and R. Wright, in IPCC Special Report on Renewable Energy Sources and Climate Change Mitigation , ed. O. Edenhofer, R. Pichs-Madruga, Y. Sokona, K. Seyboth, P. Matschoss, S. Kadner, T. Zwickel, P. Eickemer, G. Hansen, S. Schlomer and C. von Stechow, Cambridge University Press, Cambridge, United Kingdom and New York, NY, USA, 2011, pp. 791–864 Search PubMed .
- R. Wiser and M. Bolinger, 2011 Wind Technologies Market Report, U.S. Department of Energy, 2012.
- International Energy Agency, World Energy Outlook 2013, 2013.
- M. Hand, S. Baldwin, E. DeMeo, J. Reilly, T. Mai, D. Arent, G. Porro, M. Meshek and D. Sandor, Renewable Electricity Futures Study , National Renewable Energy Laboratory, Golden, CO, 2012 Search PubMed .
- P. Denholm and M. Hand, Energy Policy , 2011, 39 , 1817–1830 CrossRef PubMed .
- M. Beaudin, H. Zareipour, A. Schellenberglabe and W. Rosehart, Energy Sustainable Dev. , 2010, 14 , 302–314 CrossRef PubMed .
- Electric Power Research Institute, Electric Energy Storage Technology Options: A White Paper Primer on Applications, Costs, and Benefits, Electric Power Research Institute Technical Report #1020676, 2010.
- A. Evans, V. Strezov and T. J. Evans, Renewable Sustainable Energy Rev. , 2012, 16 , 4141–4147 CrossRef PubMed .
- J. Divisek and B. Emonts, in Handbook of Fuel Cells , ed. W. Vielstich, A. Lamm, H. A. Gasteiger and H. Yokokawa, John Wiley & Sons, Ltd, Chichester, UK, 2010, ch. 1 Search PubMed .
- G. Gahleitner, Int. J. Hydrogen Energy , 2013, 38 , 2039–2061 CrossRef CAS PubMed .
- B. Kroposki, J. Levene and K. Harrison, Electrolysis: Information and Opportunities for Electric Power Utilities, National Renewable Energy Laboratory Technical Report NREL/TP-581-40605, 2006.
- O. Z. Sharaf and M. F. Orhan, Renewable Sustainable Energy Rev. , 2014, 32 , 810–853 CrossRef CAS PubMed .
- S. Verhelst, Int. J. Hydrogen Energy , 2014, 39 , 1071–1085 CrossRef CAS PubMed .
- C. White, R. Steeper and A. Lutz, Int. J. Hydrogen Energy , 2006, 31 , 1292–1305 CrossRef CAS PubMed .
- J. Erjavic, Hybrid, Electric and Fuel-Cell Vehicles , Delmar/Cengage Learning, Inc., Clifton Park, NY, 2nd edn, 2013, ch. 11 Search PubMed .
- A. Veziroglu and R. Macario, Int. J. Hydrogen Energy , 2011, 36 , 25–43 CrossRef CAS PubMed .
- U. Eberle, B. Müller and R. von Helmolt, Energy Environ. Sci. , 2012, 5 , 8780 Search PubMed .
- D. U. Eberle and D. R. von Helmolt, Energy Environ. Sci. , 2010, 3 , 689 Search PubMed .
- J. Andrews and B. Shabani, Int. J. Hydrogen Energy , 2012, 37 , 6–18 CrossRef CAS PubMed .
- D. Steward, G. Saur, M. Penev and T. Ramsden, Lifecycle Cost Analysis of Hydrogen Versus Other Technologies for Electrical Energy Storage, National Renewable Energy Laboratory Technical Report NREL/TP-560-46719, 2009.
- M. Carbajales-Dale, C. J. Barnhart, A. R. Brandt and S. M. Benson, Nat. Clim. Change , 2014, 4 , 524–527 CrossRef .
- C. J. Barnhart, M. Dale, A. R. Brandt and S. M. Benson, Energy Environ. Sci. , 2013, 6 , 2804 Search PubMed .
- A. R. Brandt and M. Dale, Energies , 2011, 4 , 1211–1245 CrossRef PubMed .
- C. J. Rydh and B. A. Sandén, Energy Convers. Manage. , 2005, 46 , 1980–2000 CrossRef CAS PubMed .
- D. Stolten and D. Krieg, in Hydrogen and Fuel Cells , ed. D. Stolten, Wiley-VCH Verlag GmbH, 2010, ch. 12 Search PubMed .
- U.S. DOE, Multi-Year Research, Development and Demonstration Plan, U.S. DOE, 2012, ch. 3.4.
- I. Cerri, F. Lefebvre-Joud, P. Holtappels, K. Honegger, T. Stubos and P. Millet, Scientific Assessment in support of the Materials Roadmap enabling Low Carbon Energy Technologies , European Commission Joint Research Centre Institute for Energy and Transport, Petten, 2012 Search PubMed .
- B. Hobein and R. Kruger, in Hydrogen and Fuel Cells – Fundamentals, Technologies, Applications , ed. D. Stolten, Wiley-VCH Verlag GmbH & Co. KGaA, Weinheim, 2010, ch. 18 Search PubMed .
- H. Langlas, 2014, personal communication.
- M. Hirscher and M. Klell, in Handbook of Hydrogen Storage , ed. M. Hirscher, Wiley-VCH Verlag GmbH & Co. KGaA, 2010, ch. 1 Search PubMed .
- M. Weiss, J. B. Heywood, E. M. Drake, A. Shafer and F. F. AuYeung, On the road in 2020: A life-cycle analysis of new automobile technologies, Massachusetts Institute of Technology Energy Laboratory Technical Report #MIT EL 00-003, 2000.
- Y. Wang, K. S. Chen, J. Mishler, S. C. Cho and X. C. Adroher, Appl. Energy , 2011, 88 , 981–1007 CrossRef CAS PubMed .
- V. Karakoussis, M. Leach, R. van der Vorst, D. Hart, J. Lane, P. Pearson and J. Kilner, Environmental Emissions of SOFC and SPFC System Manufacture and Disposal, Imperial College of Science, Technology and Medicine Technical Report F/01/00164/REP, 2000.
- M. Pehnt, Int. J. Hydrogen Energy , 2001, 26 , 91–101 CrossRef CAS .
- A. Primas, Life Cycle Inventories of new CHP systems, Swiss Centre for Life Cycle Inventories Technical Report ecoinvent report No. 20, 2007.
- A. Burnham, Updated Vehicle Specifications in the GREET Vehicle-Cycle Model, Center for Transportation Research, Argonne National Laboratory technical report, 2012.
- I. Staffell and A. Ingram, Int. J. Hydrogen Energy , 2010, 35 , 2491–2505 CrossRef CAS PubMed .
- P. Millet and S. Grigoriev, in Renewable Hydrogen Technologies: Production, Purification, Storage, Applications and Safety , ed. L. M. Gandia, G. Arzamendi and P. M. Dieguez, Elsevier B.V., 2013, ch. 2 Search PubMed .
- M. Müller, in Fuel Cell Science and Engineering: Materials, Processes, Systems and Technology , ed. D. Stolten and B. Emonts, Wiley-VCH Verlag & Co. KGaA, 2012, ch. 8 Search PubMed .
- Ecoinvent Centre, Ecoinvent data v2.0, 2007.
- Rix Industries, Industrial Gas/Air Compressors 4VX: Compare Items, http://compressors.rixindustries.com/compare/commercial-compressors/industrial-gas-air-compressors-4vx?itemids=1038+1041.
- A. J. Verhage, J. F. Coolegem, M. J. Mulder, M. H. Yildirim and F. A. de Bruijn, Int. J. Hydrogen Energy , 2013, 38 , 4714–4724 CrossRef CAS PubMed .
- R. Sookhoo, 2014, personal communication.
- C. J. Barnhart and S. M. Benson, Energy Environ. Sci. , 2013, 6 , 1083 CAS .
- C. J. Rydh and B. A. Sandén, Energy Convers. Manage. , 2005, 46 , 1957–1979 CrossRef CAS PubMed .
- U.S. DOE/Sandia National Laboratory, DOE Global Energy Storage Database, http://www.energystorageexchange.org/.
- D. A. Notter, M. Gauch, R. Widmer, P. Wäger, A. Stamp, R. Zah and H.-J. Althaus, Environ. Sci. Technol. , 2010, 44 , 6550–6556 CrossRef CAS PubMed .
- G. Majeau-Bettez, T. R. Hawkins and A. H. Str, Environ. Sci. Technol. , 2011, 45 , 4548–4554 CrossRef CAS PubMed .
- M. K. Debe, Nature , 2012, 486 , 43–51 CrossRef CAS PubMed .
- A. Sarkar and R. Banerjee, Int. J. Hydrogen Energy , 2005, 30 , 867–877 CrossRef CAS PubMed .
- M. Neelis, H. van der Kooi and J. Geerlings, Int. J. Hydrogen Energy , 2004, 29 , 537–545 CrossRef CAS .
- F. Crotogino, S. Donadei, U. Bünger and H. Landinger, 18th World Hydrogen Energy Conference 2010 – WHEC 2010, 2010.
- J.-P. Maton, L. Zhao and J. Brouwer, Int. J. Hydrogen Energy , 2013, 38 , 7867–7880 CrossRef CAS PubMed .
- T. Reddy and D. Linden, Linden's Handbook of Batteries , McGraw-Hill Prof Med/Tech, 4th edn, 2010, p. 1200 Search PubMed .
- M. Raugei, P. Fullana-i Palmer and V. Fthenakis, Energy Policy , 2012, 45 , 576–582 CrossRef PubMed .
- D. Weissbach, G. Ruprecht, A. Huke, K. Czerski, S. Gottlieb and A. Hussein, Energy , 2013, 52 , 210–221 CrossRef PubMed .
- B. Zakeri and S. Syri, Renewable Sustainable Energy Rev. , 2015, 42 , 569–596 CrossRef PubMed .
- E. Barbour, I. A. G. Wilson, I. G. Bryden, P. G. McGregor, P. A. Mulheran and P. J. Hall, Energy Environ. Sci. , 2012, 5 , 5425 Search PubMed .
- N. Hughes and P. Agnolucci, Comprehensive Renewable Energy , Elsevier, 2012, pp. 65–95 Search PubMed .
- R. Loisel, A. Mercier, C. Gatzen, N. Elms and H. Petric, Energy Policy , 2010, 38 , 7323–7337 CrossRef PubMed .
- R. Loisel, International Journal of Electrical Power & Energy Systems , 2012, 42 , 542–552 Search PubMed .
- N. Paine, F. R. Homans, M. Pollak, J. M. Bielicki and E. J. Wilson, Energy Economics , 2014, 46 , 10–19 CrossRef PubMed .
- E. Barbour, I. G. Wilson, S. Gill and D. Infield, IET Renew. Power Gen. , 2013, 7 , 421–430 CrossRef PubMed .
- C. Azcárate, R. Blanco, F. Mallor, R. Garde and M. Aguado, Renewable Energy , 2012, 47 , 103–111 CrossRef PubMed .
Thank you for visiting nature.com. You are using a browser version with limited support for CSS. To obtain the best experience, we recommend you use a more up to date browser (or turn off compatibility mode in Internet Explorer). In the meantime, to ensure continued support, we are displaying the site without styles and JavaScript.
- View all journals
- My Account Login
- Explore content
- About the journal
- Publish with us
- Sign up for alerts
- Open access
- Published: 19 April 2022
Reversible Power-to-Gas systems for energy conversion and storage
- Gunther Glenk ORCID: orcid.org/0000-0003-2540-838X 1 &
- Stefan Reichelstein ORCID: orcid.org/0000-0003-0989-6715 2
Nature Communications volume 13 , Article number: 2010 ( 2022 ) Cite this article
10k Accesses
41 Citations
146 Altmetric
Metrics details
- Energy economics
In the transition to decarbonized energy systems, Power-to-Gas (PtG) processes have the potential to connect the existing markets for electricity and hydrogen. Specifically, reversible PtG systems can convert electricity to hydrogen at times of ample power supply, yet they can also operate in the reverse direction to deliver electricity during times when power is relatively scarce. Here we develop a model for determining when reversible PtG systems are economically viable. We apply the model to the current market environment in both Germany and Texas and find that the reversibility feature of unitized regenerative fuel cells (solid oxide) makes them already cost-competitive at current hydrogen prices, provided the fluctuations in electricity prices are as pronounced as currently observed in Texas. We further project that, due to their inherent flexibility, reversible PtG systems would remain economically viable at substantially lower hydrogen prices in the future, provided recent technological trends continue over the coming decade.
Solar methanol energy storage

Optimal supply chains and power sector benefits of green hydrogen

Techno-economic assessment of low-temperature carbon dioxide electrolysis
Introduction.
The large-scale deployment of intermittent renewable energy sources, like wind and solar, poses a growing challenge in terms of balancing energy demand and supply in real time 1 , 2 . Aside from storage in batteries 3 , 4 , electrolytic hydrogen production via Power-to-Gas (PtG) processes can absorb electricity during times of ample power supply and thereby yield hydrogen for industrial customers 5 , 6 , 7 . Conversely, PtG systems that are also capable of operating in the reverse direction can convert hydrogen back to electricity during periods of limited power supply and correspondingly high power prices 8 , 9 . Thus, reversible PtG systems can effectively connect the markets for hydrogen and electricity 10 , 11 , 12 and, in the process, limit the growing price volatility in electricity markets 13 , 14 .
Reversible PtG systems can be designed in a modular manner, for instance, by combining a one-directional electrolyzer for hydrogen production with a one-directional fuel cell or gas turbine for power generation 15 , 16 . While electrolyzers have been found to become increasingly cost-competitive in producing hydrogen 17 , 18 , fuel cells and gas turbines have so far been regarded as too expensive for converting hydrogen back to electricity that would subsequently be sold in wholesale markets 9 , 19 , 20 . In contrast, unitized regenerative fuel cells, which we refer to as integrated PtG systems, utilize the same equipment to deliver either hydrogen or electricity depending on the prevailing electricity prices at different points in time 21 , 22 , 23 .
This paper first develops an analytical model of the unit economics of reversible PtG systems. Our findings show that the technological characteristics of both modular and integrated systems entail certain ranges for hydrogen prices at which reversible PtG systems become cost-competitive. While modular systems require sufficiently low hydrogen prices in order for the reversibility feature to be valuable, integrated systems can be economically viable for higher hydrogen prices by primarily generating hydrogen but also providing electricity during times of limited power supply. Such operations will therefore not only increase the supply of hydrogen but also provide an effective buffer against the intermittency of renewable power sources.
The empirical part of our analysis calibrates the model in the context of the electricity markets in Germany and Texas. Despite improvements in the cost and conversion efficiency of modular PtG systems 24 , 25 , we confirm the findings of earlier studies that there is no economic case, either now or in the foreseeable future, for investing in modular systems that convert hydrogen back to electricity. In contrast, integrated PtG systems based on solid oxide cell (SOC) technology are shown to be competitive at current hydrogen prices, given sufficient variation in daily electricity prices, as is already encountered in the Texas market. For such systems, it is indeed efficient to mostly produce hydrogen and respond to sufficiently high electricity prices with electric power production. Owing to their relatively high capacity utilization, integrated systems are also positioned more competitively than one-directional electrolyzers on their own.
Finally, we project that if recent trends regarding the acquisition cost and conversion efficiency of solid oxide fuel cells continue, such reversible PtG systems will remain economically viable even in the presence of substantially lower hydrogen prices in the future. This is because the inherent flexibility in these systems enables them to respond to lower hydrogen prices by operating more frequently in reverse mode, delivering additional electricity to the power markets.
Real-time operation of reversible Power-to-Gas
We examine reversible PtG systems that can (i) produce hydrogen via water electrolysis and (ii) produce electricity from hydrogen and oxygen 26 . We refer to such systems as modular if the two production processes run on separate equipment, such as a one-directional electrolyzer for hydrogen production and a one-directional fuel cell or gas turbine for the reverse operation. In contrast, we refer to a unitized regenerative fuel cell based on, for instance, a SOC 10 , 27 or a proton exchange membrane (PEM) 22 , 28 technology as an integrated reversible PtG system. Such systems can carry out both production processes on the same equipment, yet they can only run in at most one direction at any point in time.
Since our interest is in the economics of reversible PtG systems, we focus on such systems operating on their own as price takers in a wholesale market for electricity in which prices are determined hourly based on supply and demand. Time is modeled as a continuous variable t ranging from 0 to 8760 h per year. Let q ( t ) denote the market price for electricity per kilowatt-hour (kWh) at time t . We initially assume that the annual distribution of power prices remains constant across the lifetime of the system. Symbols and acronyms are listed in Supplementary Table 1 .
Our model framework considers reversible PtG systems with a peak capacity in kilowatt (kW) of electricity input or output. The assumed size of a PtG system is in line with average capacity sizes reported in the literature 29 . PtG systems generally exhibit economies of scale over a certain range in the sense that system prices per kW, that is, the upfront capital cost decline as the capacity size increases up to a particular level 30 . The numerical calibration of our model relies on parameters for both system prices and operating costs that reflect average system sizes as reported in the existing literature 29 .
The basic version of our model makes the simplifying assumption that either reversible PtG system can be brought instantaneously from a cold start to full operating temperature without any loss in conversion efficiencies. Earlier work, however, shows that the process of heating SOCs up to operating temperature can require up to 20 min to prevent excessive material stress 31 . The electrical energy required for that heating amounts to a fraction of the energy needed for the subsequent electrolytic hydrogen production 32 . Reversible PtG systems based on PEM technology can be heated to operating temperature in less than 10 min 30 .
We examine the losses incurred by bringing either reversible PtG system from a cold start to full operating temperature in an extension to the basic model provided in Supplementary Note 1 . The extension explicitly accounts for (i) the time required to heat either reversible PtG system from a cold start to regular operating temperature, (ii) the energy required for the heating process, (iii) the cost of electricity or hydrogen incurred during the heating period, and (iv) the frequency of those heating periods in each year of operation. On the basis of conservative assumptions for all four of these frictions, our numerical results show that heating costs have only a small impact on the cost of either PtG system. The main reason is that the optimized PtG systems go only through a few heat-up phases per year.
Once the electrolyzer and fuel cell technologies we consider have reached their operating temperature, up- and down-ramping can be conducted in seconds 10 , 22 , 30 . The corresponding capacity factors reflect the percentage of the available capacity utilized at time t and can then be chosen flexibly on the interval [0, 1]. Efficiency losses incurred for maintaining the operating temperature are included in the conversion efficiencies considered throughout our analysis. Heat management is commonly more complex for high-temperature electrolyzers and fuel cells, such as SOC facilities, than for low-temperature PEM systems. Nevertheless, the cost of maintaining the operating temperature of well-insulated SOC systems is likely minor 32 .
If the modular system generates hydrogen at time t , it earns a “conversion price” consisting of the market price of hydrogen, p , per kilogram (kg) multiplied with the conversion rate of going from electricity to hydrogen (in kg/kWh). The hydrogen price, p , is modeled as time-invariant, because buyers and suppliers typically agree on time-invariant prices 33 . The corresponding conversion parameter \({\eta }_{h}^{o}(C{F}_{h}^{o})\) represents the amount of hydrogen (in kg) that can be generated from 1 kWh of electricity, given the capacity factor of \(C{F}_{h}^{o}\) at time t , with \(0\le C{F}_{h}^{o}\le 1\) . The variable cost of hydrogen generation equals q ( t ) plus a cost increment \({w}_{h}^{o}\) per kWh that accounts for consumable inputs, like water and reactants for deionizing the water, as well as any purchasing markups on the wholesale price of electricity.
Given a hydrogen price, p , the contribution margin per kWh from hydrogen production with the modular reversible PtG system at time t thus is:
with \(C{F}_{h}^{o}\) to be chosen at each point in time t .
Conversely, if the modular system generates electricity, it earns q ( t ) and incurs a variable cost that comprises p and an incremental cost, \({w}_{e}^{o}\) , per kWh of electricity for transporting hydrogen to the Gas-to-Power (GtP) system. To account for efficiency losses, the cost of hydrogen, p , is marked-up by the conversion rate for power generation, \({\eta }_{e}^{o}(C{F}_{e}^{o})\) (in kWh/kg). The shape of the functions \({\eta }_{h}^{o}(\cdot )\) and \({\eta }_{e}^{o}(\cdot )\) depends on the particular technology considered. The contribution margin of electricity generation per kWh at time t then becomes:
Efficient utilization of the existing capacity is obtained if the capacity factors are at each point in time chosen to maximize the total available contribution margin. While the modular system can run at full capacity in both directions, the 1st Law of Thermodynamics stipulates that the overall round-trip efficiency must satisfy the inequality \({\eta }_{h}^{o}(\cdot )\cdot {\eta }_{e}^{o}(\cdot )\le 1\) for all \(0\le C{F}_{h}^{o},C{F}_{e}^{o}\le 1\) . Consequently, at most one of the terms \([{\eta }_{h}^{o}(C{F}_{h}^{o})\cdot p-q(t)-{w}_{h}^{o}]\) or \(\left[q(t)-\frac{p}{{\eta }_{e}^{o}(C{F}_{e}^{o})}-{w}_{e}^{o}\right]\) will be positive for any given values \({w}_{h}^{o},{w}_{e}^{o}\ge 0\) . As illustrated in Fig. 1 (see Methods for formal derivations), efficient system utilization thus implies that the capacity factors be chosen so that \(C{F}_{h}^{o}\cdot C{F}_{e}^{o}=0\) . Specifically, the optimal capacity factors, \(C{F}_{h}^{o* }(t| p)\) and \(C{F}_{e}^{o* }(t| p)\) maximize pointwise the sum of the contribution margins in ( 1 ) and ( 2 )(see Methods for details). When aggregated across the hours of a year, the maximized contribution margins will be denoted by \(C{M}_{h}^{o}(p)\) and \(C{M}_{e}^{o}(p)\) .

The figure illustrates the three alternative operating modes for either a modular or an integrated reversible PtG system that emerge for varying electricity prices. Wholesale electricity prices can turn negative as a result of surplus energy being supplied to the grid at certain hours.
For the integrated system, the economic trade-off is principally the same, except that the incremental cost and conversion rates may differ and instead assume the values w h , w e , η h ( ⋅ ), and η e ( ⋅ ), respectively. Once they are at operating temperature, unitized regenerative fuel cells based on SOC or PEM technology can rapidly switch between hydrogen and electricity production at full capacity 22 , 27 . Figure 1 illustrated that provided there are no sudden jumps in electricity prices, time intervals where electricity generation is valuable will typically be followed by a time interval in which the system is idle before entering a stretch of time where the regenerative fuel cell again becomes active in either mode of operation.
By construction, the integrated system faces the technical rather than economic “complementary slackness” condition C F h ⋅ C F e = 0 for all t . The corresponding contribution margins are:
for hydrogen production, and
for electricity. The capacity factors that maximize the sum of the contribution margins in ( 3 ) and ( 4 ), subject to the complementary slackness constraint, are denoted by \(C{F}_{h}^{* }(t| p)\) and \(C{F}_{e}^{* }(t| p)\) , respectively. Given these capacity factors, we denote by C M ( p ) the optimized aggregate contribution margin which is obtained as the total contribution margin obtained after integrating ( 3 ) and ( 4 ) across the hours of the year.
Cost competitiveness and the value of reversibility
A reversible PtG system is said to be cost-competitive if the required upfront investment in equipment yields a positive net present value in terms of discounted future cash flows. The discounted annual stream of optimized contribution margin of the system must then at least cover the initial equipment expenditure. For direct comparison, it will be convenient to capture this economic trade-off on a levelized basis. Analogous to the commonly known levelized cost of electricity, the levelized fixed cost (LFC) of a reversible PtG system reflects the unit acquisition cost of the system per kWh, including applicable fixed operating costs, corporate income taxes, and the cost of debt and equity 34 , 35 .
For the modular system, the LFC for the electrolyzer is denoted by \(LF{C}_{h}^{o}\) . As shown in Methods, the PtG subsystem is cost-competitive (positive net present value) if and only if at the prevailing market price for hydrogen, p :
Since the contribution margin from hydrogen is increasing in the selling price of hydrogen, there exists a unique break-even price, \({p}_{h}^{o}\) , such that PtG will be cost-competitive whenever \(p\ge {p}_{h}^{o}\) . Similarly, the Gas-to-Power subsystem is cost-competitive whenever:
with \(LF{C}_{e}^{o}\) denoting the corresponding LFC per kWh. Since the contribution margin from producing electricity is decreasing in the input price for hydrogen, p , there also exists a unique break-even price, \({p}_{e}^{o}\) , below which GtP will be cost-competitive.
By design, investors in a modular system retain the option of acquiring only one of the two subsystems. We, therefore, call the modular system cost-competitive if at least one of its subsystems is cost-competitive. In addition, the reversibility feature of the system is said to be valuable if both subsystems have positive net present value on their own. The following finding links cost-competitiveness and the value of reversibility to the prevailing market price of hydrogen.
Finding 1: The modular reversible PtG system is cost-competitive if and only if at the prevailing hydrogen market price, p , either \(p\, > \,{p}_{h}^{o}\) or \(p \, < \, {p}_{e}^{o}\) . Reversibility of the modular system is valuable if and only if \(p\in [{p}_{h}^{o},{p}_{e}^{o}]\) .
Figure 2 a illustrates the setting of a modular reversible PtG system that is cost-competitive and for which reversibility is valuable. Note that reversibility of the modular system cannot be of value unless \({p}_{h}^{o}\, < \,{p}_{e}^{o}\) .

The figure illustrates the potential cost-competitiveness and value of reversible operation in terms of the respective break-even prices of ( a ) a modular reversible Power-to-Gas system, and ( b ) an integrated reversible Power-to-Gas system.
For the integrated reversible PtG system, the LFC of the system is denoted by \(LFC\) . Cost competitiveness of the integrated system then requires that the optimized aggregate contribution margin, C M ( p ), exceeds \(LFC\) . The reversibility of the integrated system is said to be valuable if at the prevailing market price of hydrogen, p , investment in the system is cost-competitive and, furthermore, the system operates in both directions for select hours of the year, i.e., both sets \(\{t| C{F}_{h}^{* }(t| p) \, > \, 0\}\) and \(\{t| C{F}_{e}^{* }(t| p) \, > \, 0\}\) have positive length across the hours of the year.
Figure 2 b illustrates a setting in which the reversibility feature of the integrated reversible PtG system is valuable. We note that when viewed as a function of p , the optimized contribution margin, C M ( ⋅ ), is drawn as a U-shaped curve. This follows directly from the convexity of this function in p (see Methods), combined with the observation that C M ( p ) is increasing for large values of p and again increasing as p becomes small, possibly negative. The U-shape of C M ( ⋅ ) implies that there exist at most two break-even points at which C M ( p ) = LFC. These points are denoted by \({p}_{* }\) and \({p}^{* }\) , respectively.
To examine the value of reversibility, suppose hypothetically that the integrated system could operate in only one direction. For instance, suppose the system is constrained to only produce hydrogen (i.e., C F e in ( 4 ) is set identically equal to zero for all t ). For sufficiently large values of p , there then exists a critical value denoted by \(\bar{p}\) such that \(CM(\bar{p})=C{M}_{h}(\bar{p})\) . This equality holds for all \(p\ge \bar{p}\) . Conversely, there exists a lower critical price below which only electricity generation would be valuable, that is, C M ( p ) = C M e ( p ) for all \(p\le \underline{p}\) .
Finding 2: The integrated reversible PtG system is cost-competitive if and only if the prevailing hydrogen market price, p , does not fall into the range [ \({p}_{* }\) , \({p}^{* }\) ]. Reversibility of the integrated system is valuable if and only if either \(p\in (\underline{p},{p}_{* })\) or \(p\in ({p}^{* },\bar{p})\) .
Finding 2 shows that an integrated reversible PtG system is cost-competitive if the market price of hydrogen moves either into an upper or lower range relative to the price at which the optimized contribution margin reaches its minimum. For the case where \(p\in ({p}^{*},\bar{p})\) , Fig. 2 b depicts the possibility that the integrated system primarily generates hydrogen but also operates bi-directionally. Such systems could create an effective buffer against the intermittency of renewables when power is absorbed from the electricity market for hydrogen conversion, yet occasionally electricity is generated at hours of limited power supply and correspondingly high power prices. The range of hydrogen prices at which an integrated system generates both outputs hinges, in addition to cost, on the round-trip efficiency and the volatility in power prices (Fig. 1) .
An implicit assumption underlying Finding 2 and Fig. 2 b is that LFC exceeds the minimum of the C M ( ⋅ ) curve, for otherwise the break-even prices \({p}_{* }\) and \({p}^{* }\) do not exist (we ignore the non-generic scenario in which there is exactly one break-even price at a tangential point). In case L F C < C M ( ⋅ ) for all p , the integrated reversible PtG system will always be cost-competitive and reversibility will be of value for all hydrogen prices within the interval \((\underline{p},\bar{p})\) . In this case, the flexibility of the integrated reversible PtG system allows it to compensate for any decline in the prevailing market price of hydrogen by turning to electricity production for a larger share of the available time.
Current economics of reversible Power-to-Gas
To apply the preceding model framework, we calibrate the model parameters in the current market environment of Germany and Texas. Both jurisdictions have recently deployed considerable amounts of renewable energy 36 . While Germany has maintained coal and natural gas plants as capacity reserves, Texas has retired several conventional generators 37 . The average wholesale electricity price in 2019 was comparable for both jurisdictions, yet power prices in Texas exhibited much higher volatility. As detailed further in Methods and Supplementary Tables 2 – 5 , our calculations rely on a range of data sources collected from journal articles, industry data, and publicly available reports. Table 1 summarizes the average values of key cost and operational parameter estimates.
Our numbers for the modular PtG system are based on a one-directional PEM electrolyzer and a combined-cycle gas turbine. Recent literature attributes about the same conversion rate to stationary PEM fuel cells as to combined-cycle gas turbines, though the former also entail higher system prices 20 , 38 . For the integrated reversible PtG system, we consider unitized generative SOC fuel cells that are already commercially available 30 , 38 . Regarding the conversion efficiency, we note that PEM electrolyzers attain a near-constant efficiency beyond a small threshold utilization level 30 . For integrated PtG systems, we interpret the conversion efficiency parameters identified in the literature (shown in Table 1) as those obtained at full capacity utilization. Thus far, the existing literature provides no evidence on the shape of the functions η h ( ⋅ ) and η e ( ⋅ ). If these conversion rates were to decrease significantly for capacity utilization values approaching one, our findings regarding the cost competitiveness of integrated reversible PtG systems should be interpreted as a lower bound, because the achievable optimized contribution margins might then be larger for capacity factors strictly less than one. Supplementary Note 2 further examines the sensitivity of our numerical findings to changes in the conversion rates of such systems.
The investing party is assumed to have access to the day-ahead wholesale market for electricity (see Supplementary Note 3 for findings based on the real-time wholesale market for electricity). In order to accelerate the transition towards renewable energy, the German government recently decided that electricity purchases for water electrolysis are exempted from certain taxes and fees paid by industrial customers 39 . In Texas, the investing party is assumed to be able to purchase electricity at wholesale prices subject to a markup, as imposed by suppliers like Griddy (see Supplementary Tables 4 – 5) .
We first determine the hydrogen break-even prices. To assess the cost competitiveness of each (sub-)system, we then compare the break-even prices to prevailing transaction prices for hydrogen supply. These values are applicable benchmarks for hydrogen as both an input and an output when the PtG (or GtP) system can be installed nearby a hydrogen or electricity customer. Market prices currently fall into three segments that vary with purity and scale (volume): large-scale supply between 1.5 and 2.5 €/kg, medium-scale between 3.0 and 4.0 €/kg, and small-scale above 4.0 €/kg 33 .
Our calculations yield break-even prices for the modular electrolyzer ( \({p}_{h}^{o}\) ) of 3.18 €/kg in Germany and 2.98 $/kg in Texas, while the break-even prices for the modular gas turbine ( \({p}_{e}^{o}\) ) are 0.57 €/kg in Germany and 1.31 $/kg in Texas (Table 2 , see Supplementary Tables 6 – 7 for details). The much higher break-even price for the GtP system in Texas must be attributed to the higher volatility in Texas wholesale electricity prices, which in 2019 exceeded 0.15 $¢/kWh on a regular basis.
Finding 1 implies that modular PtG conversion is cost-competitive in both jurisdictions relative to the prices paid for small- and medium-scale hydrogen supply, while the GtP subsystem is not. Furthermore, the reversibility of the modular system cannot be valuable relative to any prevailing market price for hydrogen because \({p}_{h}^{o}\, > \,{p}_{e}^{o}\) in both jurisdictions. Our results here confirm the commonly held view that one-directional GtP systems are currently not economically viable 9 , 19 , 20 .
For the integrated system, our calculations yield break-even prices of 0.03 €/kg for \({p}_{* }\) and 3.38 €/kg for \({p}^{* }\) in Germany, while the break-even prices in Texas are −0.09 $/kg and 2.78 $/kg, respectively (Table 2) . The substantially smaller \({p}^{* }\) in Texas reflects the higher volatility in wholesale power prices. By Finding 2, the integrated system is thus cost-competitive when hydrogen is sold to small- and medium-scale customers in Germany. In Texas, cost competitiveness is achieved even relative to a hydrogen price of at least $2.78 per kg, a value that is borderline for industrial-scale supply.
Regarding the value of reversibility for the integrated system, our calculations yield upper and lower critical prices ( \(\underline{p}\) and \(\bar{p}\) ) of −1.81 €/kg and 2.43 €/kg, respectively, in Germany. In Texas, the corresponding values are 0.59 $/kg for \(\underline{p}\) , while \(\bar{p}\) exceeds 5.0 $/kg. Because the hydrogen prices for medium scale supply fall “comfortably” into the range \(({p}^{* },\bar{p})=(2.78,5.0)\) , we conclude that the reversibility of the integrated PtG system is already valuable in the current Texas environment. Contrary to frequently articulated views in the popular press, the generation of electric power from hydrogen is therefore already economical, provided such generation is part of an integrated PtG system that mainly produces hydrogen yet only occasionally operates in the reverse direction to generate electricity. Such systems can therefore be effective in buffering the increasing volatility in power markets resulting from the growing reliance on intermittent renewable energy sources.
A direct comparison of the modular one-sided and the integrated reversible PtG systems shows that the latter is already positioned more competitively despite its substantially higher systems price, as the break-even price of $2.78 per kg is below the corresponding $2.98 per kg for the modular electrolyzer.
Prospects for reversible Power-to-Gas
Recent technological progress in reversible PtG systems suggests further improvements in terms of declining system prices and increasing conversion efficiencies 40 , 41 , 42 . System prices of PEM electrolyzers are forecast to decline at an annual rate of 4.77%, while conversion rates are likely to increase linearly to on average 0.023 kg/kWh by 2030 20 , 33 , 43 . For combined-cycle gas turbines, both of these parameters are expected to remain unchanged.
To assess the cost dynamics of the unitized generative SOC fuel cell, we rely on a hand-collected data set of N = 79 price observations, as described in Methods. We estimate the trajectory of system price by means of a univariate regression covering the years 2000–2019. The functional form of the regression is a constant elasticity model of the form: v ( i ) = v (0) ⋅ β i , with v ( i ) representing the system price in year i . As shown in Fig. 3 , the resulting estimate for the annual price decline is 8.95% ( β = 0.9105) with a 95% confidence interval of ± 3.20% ( R 2 = 0.27).

Cost data comes from multiple sources. The univariate regression suggests a constant cost decline over the coming years. The fairly large variance in system prices illustrates the relative novelty of the technology.
The conversion rate of the regenerative SOC fuel cell is expected to increase linearly to on average 0.024 kg/kWh for hydrogen generation and 21.67 kWh/kg for power generation by 2030 20 , 38 . Our calculations are based on the current distribution of power prices to isolate the effects of falling system prices and improved conversion rates. A fall in the average of power prices in connection with rising price volatility, as previous studies suggest 13 , 14 , 44 , 45 , would affect the economics of either system favorably.
Our model results in a trajectory of break-even prices through 2030 as shown in Fig. 4 (see Supplementary Tables 8 , 9 for details). The green lines indicate that the modular electrolyzer is likely to become cost-competitive even relative to the lower prices in the large-scale hydrogen market segment. This conclusion emerges sooner in Texas due to higher volatility in power prices. The break-even prices for the modular gas turbine, as depicted by the orange lines, are projected to remain unchanged. Even though the gap between \({p}_{h}^{o}\) and \({p}_{e}^{o}\) is shrinking, the reversibility feature of the modular system is unlikely to become valuable during the next decade. This stands in contrast to recent ambitions by gas turbine equipment manufacturers 46 , 47 , 48 .

This figure contrasts the relevant hydrogen prices of modular and integrated reversible Power-to-Gas systems in ( a ) Germany and ( b ) Texas with the hydrogen prices attained in different market segments. The lower critical price of the integrated system in Germany is consistently below −1.5 €/kg. The upper critical price of the integrated system in Texas is consistently above 5.0 $/kg.
The integrated system, in contrast, is projected to become widely cost-competitive for large-scale hydrogen supply in both jurisdictions as shown by the upper blue lines in Fig. 4 . We furthermore project the reversibility feature of the integrated system to become increasingly valuable in both jurisdictions as indicated by the falling upper blue lines. In fact, for Texas, the range [ \({p}_{* }\) , \({p}^{* }\) ] is almost closing by the end of the coming decade. As explained in the modeling section, a closing of the range corresponds to the scenario where the flexibility inherent in the unitized regenerative fuel cell allows it to achieve an optimized contribution margin that exceeds the LFC of the system, regardless of the prevailing hydrogen price.
In Germany, the reversibility feature of the integrated system is likely to deliver value starting in the second half of the coming decade. This can be seen in Fig. 4 a by comparing the upper blue line with the blue dots, which illustrate the trajectory of the upper critical prices ( \(\bar{p}\) ) for the integrated system. The reason is that, as the upper break-even price falls, the reversible PtG system will increasingly switch to power generation, as opposed to staying idle, when electricity prices peak (Fig. 1) .
Our analysis has demonstrated that recent advances in unitized regenerative solid oxide fuel cells already make such systems competitive relative to current hydrogen prices. By taking advantage of fluctuations in hourly electricity prices, reversible PtG systems not only act as buffers in electricity markets, they also broaden the supply sources for hydrogen as an industrial input and general energy carrier. If recent trends in the acquisition cost of SOCs continue over the next 5–10 years, our projections indicate that such systems will remain competitive even in the face of substantially lower hydrogen prices, as the electrolyzer then adjusts by operating more frequently as a Gas-to-Power system.
Several promising avenues for future research emerge from our analysis. Earlier work has shown that the economics of electrolyzers can be improved by vertically integrating them with upstream renewable energy sources to achieve operational synergies 49 . It remains to be seen to what extent the addition of a renewable power source would improve the capacity utilization of a reversible PtG system and, therefore, lower the corresponding break-even values. Furthermore, if one views a reversible PtG system as an energy storage device, the natural question is how its competitiveness compares to that of other storage technologies, such as batteries or pumped hydro-power systems 8 , 9 , 50 , 51 .
From an industry and policy perspective, we note that the inherent flexibility of integrated reversible PtG systems makes them valuable during periods of electricity scarcity, including regular demand peaks and irregular supply shocks. With increasing penetration levels of renewable energy, this flexibility feature is likely to become more valuable over time. We finally note that our projections regarding the economic positioning of reversible PtG systems in the future have relied on a regression model that presumes that cost declines are a function of calendar time. Yet, the literature on clean energy technologies has shown that cost declines are not merely an exogenous function of time but instead are determined endogenously by the cumulative number of deployments of these systems 43 . Policy-makers should keep these long-term benefits in mind in adopting regulatory policies aimed at accelerating the rate of PtG system deployments in the short run.
Derivation of the aggregate contribution margins
We begin with the derivation of the optimized aggregate contribution margin, CM ( p ), that is attainable annually if the investor acquires a 1 kW system of the integrated reversible PtG system and the prevailing market price of hydrogen is p . By construction:
subject to 0 ≤ C F h , C F e ≤ 1 and the technical constraint that the unitized regenerative fuel cell can only run in one direction at any point in time. It follows that C M ( p ) is additively separable and can be written as C M ( p ) = C M h ( p ) + C M e ( p ), with:
Here, \(C{F}_{h}^{* }(t| p)\) and \(C{F}_{e}^{* }(t| p)\) are chosen to maximize [ η h ( C F h ) ⋅ p − q ( t ) − w h ] and \([q(t)-\frac{p}{{\eta }_{e}(C{F}_{e})}-{w}_{e}]\) , respectively, at all points in time t .
For the modular reversible PtG systems, the aggregate optimized contribution margins \(C{M}_{h}^{o}(p)\) and \(C{M}_{e}^{o}(p)\) are derived in direct analogy to ( 8 ).
Convexity of C M ( ⋅ ) in p
We demonstrate the convexity of the aggregate annual contribution margin pointwise, that is, convexity holds at any point in time t . Specifically, it suffices to show that for any 0 ≤ λ ≤ 1:
where p λ ≡ λ ⋅ p 1 + (1 − λ ) ⋅ p 0 , \(A(t| p)\equiv {\eta }_{h}(C{F}_{h}^{* }(t| p))\cdot p-q(t)-{w}_{h}\) and \(B(t| p)\equiv q(t)-\frac{p}{{\eta }_{e}(C{F}_{e}^{* }(t| p))}-{w}_{e}\) . As noted above, for any p , either A ( t ∣ p ) ≤ 0 or B ( t ∣ p ) ≤ 0 because η h ( ⋅ ) ⋅ η e ( ⋅ ) ≤ 1.
Suppose now, without loss of generality, that A ( t ∣ p λ ) > 0 in which case the left-hand side of the preceding inequality is equal to A ( t ∣ p λ ). Finally, the right-hand side of the above inequality is given by:
By construction, this last expression is at least as large as λ ⋅ A ( t ∣ p 1 ) + (1 − λ ) ⋅ A ( t ∣ p 0 ), which, because of the linearity of A ( t ∣ ⋅ ) in p , is equal to A ( t ∣ p λ ), thus establishing the desired inequality. The claim regarding convexity of C M ( ⋅ ) then follows from the observation that the sum (integral) of convex functions is also convex.
Net present value of the reversible PtG systems
As before, we focus on integrated reversible PtG systems, with the derivation for modular systems being entirely analogous. The LFC of the system, LFC , aggregates all fixed expenditures required over the life of the reversible PtG system. This aggregate expenditure is then divided by L , the levelization factor that expresses the discounted number of hours that the capacity is available over its lifetime. The resulting cost is then a unit cost per hour of operation. Formally:
Here, f represents the levelized value of fixed operating costs, c represents the levelized capacity cost per kWh, and Δ captures the impact of income taxes and the depreciation tax shield. Denoting by v the system price of the regenerative fuel cell per kW of peak electricity absorption and desorption, we have:
with the levelization factor calculated as:
Here, m denotes the number of hours per year, that is, m = 8760 and the parameter T represents the number of years of useful economic life of the system. Since capacity may degrade over time, we denote by x the degradation factor so that x i −1 gives the fraction of the initial capacity that is functioning in year i . The parameter γ = (1 + r ) −1 and represents the discount factor with r as the cost of capital. This interest rate should be interpreted as the weighted average cost of capital if the levelized cost is to incorporate returns for both equity and debt investors. Similarly, the levelized fixed operating cost per kWh similarly comprises the total discounted fixed operating cost incurred over the lifetime of the system:
The cost of capacity is affected by corporate income taxes through a debt and a depreciation tax shield, as interest payments on debt and depreciation charges reduce the taxable earnings of a firm. The debt tax shield is included in the calculation if r is interpreted as the weighted average cost of capital. Let d i denote the allowable tax depreciation charge in year i . Since the assumed lifetime for tax purposes is usually shorter than the actual economic lifetime, we set d i = 0 in those years. If α represents the effective corporate income tax rate, the tax factor is given by:
The formal claim then is that the net present value of an investment in one kW of the integrated reversible PtG system is given by:
This relation is readily verified by noting that the after-tax cash flows in year i is:
where I i ( p ) denotes the taxable income in year i . Specifically:
Since C F L 0 = − v , the discounted value of all after-tax cash flows is indeed equal to the expression in ( 16 ). Similar reasoning yields that the unit net present values of the modular PtG and GtP systems are, respectively, given by:
Cost dynamics of solid oxide cells
We collected cost estimates from a range of information sources, including industry publications, academic articles in peer-reviewed journals and technical reports by agencies, consultancies, and analysts. These documents were retrieved by searching the database Scopus and the web with Google’s search engine using a combination of one of the five technology-specific keywords ‘reversible electrolyzer’, ‘reversible fuel cell’, ‘solid oxide electrolysis cell’, ‘solid oxide fuel cell’, or ‘reversible PtG’ with the two economic keywords ‘cost’ and ‘investment’. For industry statements, we also searched with the name of a manufacturer in combination with the economic keywords. For the Google search, we reviewed the top 100 search results. The review and the data set is documented in an Excel file available as Supplementary Data 1 .
The review yielded 211 sources, which we filtered by several criteria to ensure quality and timeliness. First, we excluded results published before the year 2000 and, for journal articles, results published in a journal with a rank below 0.5 in the Scimago Journal and Country Rank. The threshold of 0.5 showed to be effective for excluding articles published, for instance, in conference proceedings without peer-review. As for technical reports, we only included results that could convince through appearance, writing, clarity of methodology, and reputation of the author(s) or authoring organization(s). These measures removed 47 sources. Reviewing the resulting stock of sources, we further excluded sources that did not provide direct cost or efficiency data (49) and sources citing other articles as original sources (29). These citations were traced back to the original source. If the original was new, we added it to the pool. We further added sources that we found with a previous review 33 and that were new to the pool.
Our procedure left 86 sources with original data from industry or an original review of multiple sources and yielded 89 cost estimates. In case the sources issued range estimates, we took the arithmetic mean of the highest and the lowest value. The common currency is Euro and all data points in other currencies were converted using the average exchange rate of the respective year as provided by the European Central Bank. Regarding inflation, all historic cost estimates were adjusted using the HCPI of the Euro Zone as provided by the European Central Bank. The cost estimates were winsorized at a 1.0% level. Figure 3 in the main body shows the cost estimates and regression results.
Data availability
The data used in this study are referenced in the main body of the paper and the Supplementary Information. Data that generated the plots in the paper are provided in the Supplementary Information. Additional information is available from the corresponding author upon request.
Code availability
Computational code is available upon request to the corresponding author.
Davis, S. J. et al. Net-zero emissions energy systems. Science 360 , 9793 (2018).
Olauson, J. et al. Net load variability in the Nordic countries with a highly or fully renewable power system. Nat. Energy 1 , 1–14 (2016).
Article Google Scholar
Sternberg, A. et al. Power-to-what?—Environmental assessment of energy storage systems. Energy Environ. Sci. 8 , 389–400 (2015).
Article CAS Google Scholar
Comello, S. & Reichelstein, S. The emergence of cost effective battery storage. Nat. Commun. 10 , 2038 (2019).
Article ADS Google Scholar
Shaner, M. R., Atwater, H. A., Lewis, N. S. & McFarland, E. W. A comparative technoeconomic analysis of renewable hydrogen production using solar energy. Energy Environ. Sci. 9 , 2354–2371 (2016).
Van Vuuren, D. P. et al. Alternative pathways to the 1.5 ∘ C target reduce the need for negative emission technologies. Nat. Clim. Change 8 , 391–397 (2018).
Parkinson, B., Balcombe, P., Speirs, J. F., Hawkes, A. D. & Hellgardt, K. Levelized cost of CO 2 mitigation from hydrogen production routes. Energy Environ. Sci. 12 , 19–40 (2019).
Arbabzadeh, M., Sioshansi, R., Johnson, J. X. & Keoleian, G. A. The role of energy storage in deep decarbonization of electricity production. Nat. Commun. 10 , 3413 (2019).
Sepulveda, N. A., Jenkins, J. D., Edington, A., Mallapragada, D. S. & Lester, R. K. The design space for long-duration energy storage in decarbonized power systems. Nat. Energy 6 , 506–516 (2021).
Hauch, A. et al. Recent advances in solid oxide cell technology for electrolysis. Science 370 , 6513 (2020).
van Renssen, S. The hydrogen solution? Nat. Clim. Change 10 , 799–801 (2020).
Ueckerdt, F. et al. Potential and risks of hydrogen-based e-fuels in climate change mitigation. Nat. Clim. Change 11 , 384–393 (2021).
Wozabal, D., Graf, C. & Hirschmann, D. The effect of intermittent renewables on the electricity price variance. OR Spectr. 38 , 687–709 (2016).
Article MathSciNet Google Scholar
Ketterer, J. C. The impact of wind power generation on the electricity price in Germany. Energy Econ. 44 , 270–280 (2014).
Guerra, O. J. et al. The value of seasonal energy storage technologies for the integration of wind and solar power. Energy Environ. Sci. 13 , 1909–1922 (2020).
Staffell, I. et al. The role of hydrogen and fuel cells in the global energy system. Energy Environ. Sci. 12 , 463–491 (2019).
Guerra, O. J., Eichman, J., Kurtz, J. & Hodge, B. M. Cost competitiveness of electrolytic hydrogen. Joule 3 , 2425–2443 (2019).
Rau, G. H., Willauer, H. D. & Ren, Z. J. The global potential for converting renewable electricity to negative-CO 2 -emissions hydrogen. Nat. Clim. Change 8 , 621–626 (2018).
Braff, W. A., Mueller, J. M. & Trancik, J. E. Value of storage technologies for wind and solar energy. Nat. Clim. Change 6 , 964–969 (2016).
International Energy Agency. The Future of Hydrogen . Tech. Rep. (International Energy Agency, 2019).
Ding, H. et al. Self-sustainable protonic ceramic electrochemical cells using a triple conducting electrode for hydrogen and power production. Nat. Commun. 11 , 1907 (2020).
Regmi, Y. N. et al. A low temperature unitized regenerative fuel cell realizing 60% round trip efficiency and 10,000 cycles of durability for energy storage applications. Energy Environ. Sci. 13 , 2096–2105 (2020).
Elcogen. Reversible solid oxide cell technology as a power storing solution for renewable energy (Italy). http://bit.ly/385mR4N (2018).
Schmidt, O., Melchior, S., Hawkes, A. & Staffell, I. Projecting the future levelized cost of electricity storage technologies. Joule 13 , 1–20 (2019).
Proost, J. State-of-the art CAPEX data for water electrolysers, and their impact on renewable hydrogen price settings. Int. J. Hydrog. Energy 44 , 4406–4413 (2019).
Pellow, M. A., Emmott, C. J., Barnhart, C. J. & Benson, S. M. Hydrogen or batteries for grid storage? A net energy analysis. Energy Environ. Sci. 8 , 1938–1952 (2015).
Mogensen, M. B. et al. Reversible solid-oxide cells for clean and sustainable energy. Clean. Energy 3 , 175–201 (2019).
Peng, X. et al. Hierarchical electrode design of highly efficient and stable unitized regenerative fuel cells (URFCs) for long-term energy storage. Energy Environ. Sci. 13 , 4872–4881 (2020).
International Energy Agency. Hydrogen Projects Database (2020). https://www.iea.org/data-and-statistics/data-product/hydrogen-projects-database . Date accessed: 03.04.2022.
Buttler, A. & Spliethoff, H. Current status of water electrolysis for energy storage, grid balancing and sector coupling via power-to-gas and power-to-liquids: A review. Renew. Sustain. Energy Rev. 82 , 2440–2454 (2018).
Beney, A. M. Investigation into the Heat Up Time for Solid Oxide Fuel Cells in Automotive Applications . Tech. Rep. (University of Guelph, 2018).
Graves, C., Ebbesen, S. D., Mogensen, M. & Lackner, K. S. Sustainable hydrocarbon fuels by recycling CO 2 and H 2 O with renewable or nuclear energy. Renew. Sustain. Energy Rev. 15 , 1–23 (2011).
Glenk, G. & Reichelstein, S. Economics of converting renewable power to hydrogen. Nat. Energy 4 , 216–222 (2019).
Article ADS CAS Google Scholar
Reichelstein, S. & Rohlfing-Bastian, A. Levelized product cost: Concept and decision relevance. Account. Rev. 90 , 1653–1682 (2015).
MIT. The Future of Coal: Options for a Carbon-Constrained World . Tech. Rep. (Massachusetts Institute of Technology, 2007).
International Energy Agency. C O 2 Emissions from Fuel Combustion 2017 - Highlights . Tech. Rep. (International Energy Agency, 2017).
Reuters. Texas power prices jump to record high as heat bakes state. https://reut.rs/2tw4h78 (2019).
Weidner, E., Ortiz Cebolla, R. & Davies, J. Global Deployment of Large Capacity Stationary Fuel Cells. Tech. Rep. (Publications Office of the European Union, 2019).
Bundesrat. 383/19 Gesetz zur Änderung des Gesetzes über Energiedienstleistungen und andere Energieeffizienzmaßnahmen. https://www.bundesrat.de/bv.html?id=0383-19 (2019).
Rivera-Tinoco, R., Schoots, K. & Van Der Zwaan, B. Learning curves for solid oxide fuel cells. Energy Convers. Manag. 57 , 86–96 (2012).
Wei, M., Smith, S. J. & Sohn, M. D. Experience curve development and cost reduction disaggregation for fuel cell markets in Japan and the US. Appl. Energy 191 , 346–357 (2017).
Saba, S. M., Müller, M., Robinius, M. & Stolten, D. The investment costs of electrolysis—A comparison of cost studies from the past 30 years. Int. J. Hydrog. Energy 43 , 1209–1223 (2018).
Glenk, G., Meier, R. & Reichelstein, S. Cost dynamics of clean energy technologies. Schmalenbach J. Bus. Res. 73 , 179–206 (2021).
Paraschiv, F., Erni, D. & Pietsch, R. The impact of renewable energies on EEX day-ahead electricity prices. Energy Policy 73 , 196–210 (2014).
Kök, A. G., Shang, K. & Yücel, S. Impact of electricity pricing policies on renewable energy investments and carbon emissions. Manag. Sci. 64 , 131–148 (2018).
Uniper SE. Siemens und Uniper bündeln Kräfte bei Dekarbonisierung der Stromerzeugung. https://bit.ly/3iuJ0lm (2020).
Businesswire. Mitsubishi power cuts through the complexity of decarbonization: Offers the world’s first green hydrogen standard packages for power balancing and energy storage (2020). https://bwnews.pr/3yXxMLT .
General Electric. Hydrogen for Power Generation . Tech. Rep. (General Electric, 2021).
Glenk, G. & Reichelstein, S. Synergistic value in vertically integrated Power-to-Gas energy systems. Prod. Oper. Manag. 29 , 526–546 (2020).
Albertus, P., Manser, J. S. & Litzelman, S. Long-duration electricity storage applications, economics, and technologies. Joule 4 , 21–32 (2020).
Baumgarte, F., Glenk, G. & Rieger, A. Business models and profitability of energy storage. iScience 23 , 101554 (2020).
Download references
Acknowledgements
We gratefully acknowledge financial support through the Deutsche Forschungsgemeinschaft (DFG, German Research Foundation): Project-ID 403041268, TRR 266. This research was also supported by the Joachim Herz Stiftung and the Hanns-Seidel-Stiftung with funds from the Federal Ministry of Education and Research of Germany. Helpful comments were provided by Stefanie Burgahn, Céleste Chevalier, Stephen Comello, Gunther Friedl, Rebecca Meier, Christian Stoll, Nikolas Wölfing, and colleagues at the University of Mannheim, the Technical University of Munich, and the Massachusetts Institute of Technology. Finally, we thank Lisa Fuhrmann for providing valuable assistance with the data collection.
Open Access funding enabled and organized by Projekt DEAL.
Author information
Authors and affiliations.
Mannheim Institute for Sustainable Energy Studies, University of Mannheim, MIT CEEPR, Massachusetts Institute of Technology, Cambridge, MA, USA
Gunther Glenk
Mannheim Institute for Sustainable Energy Studies, University of Mannheim, Graduate School of Business, Stanford University, Leibniz Centre for European Economic Research (ZEW), Mannheim, Germany
- Stefan Reichelstein
You can also search for this author in PubMed Google Scholar
Contributions
G.G. initiated the research question and the techno-economic model. He also conducted the literature review, the data collection, and the numerical calculations. G.G. and S.R. jointly analyzed the economic model and both contributed to the writing of the paper.
Corresponding author
Correspondence to Gunther Glenk .
Ethics declarations
Competing interests.
The authors declare no competing interests.
Peer review
Peer review information.
Nature Communications thanks Joris Proost and the other, anonymous, reviewer(s) for their contribution to the peer review of this work. Peer reviewer reports are available.
Additional information
Publisher’s note Springer Nature remains neutral with regard to jurisdictional claims in published maps and institutional affiliations.
Supplementary information
Supplementary information, peer review file, description of additional supplementary files, supplementary data 1, rights and permissions.
Open Access This article is licensed under a Creative Commons Attribution 4.0 International License, which permits use, sharing, adaptation, distribution and reproduction in any medium or format, as long as you give appropriate credit to the original author(s) and the source, provide a link to the Creative Commons license, and indicate if changes were made. The images or other third party material in this article are included in the article’s Creative Commons license, unless indicated otherwise in a credit line to the material. If material is not included in the article’s Creative Commons license and your intended use is not permitted by statutory regulation or exceeds the permitted use, you will need to obtain permission directly from the copyright holder. To view a copy of this license, visit http://creativecommons.org/licenses/by/4.0/ .
Reprints and permissions
About this article
Cite this article.
Glenk, G., Reichelstein, S. Reversible Power-to-Gas systems for energy conversion and storage. Nat Commun 13 , 2010 (2022). https://doi.org/10.1038/s41467-022-29520-0
Download citation
Received : 18 February 2021
Accepted : 14 March 2022
Published : 19 April 2022
DOI : https://doi.org/10.1038/s41467-022-29520-0
Share this article
Anyone you share the following link with will be able to read this content:
Sorry, a shareable link is not currently available for this article.
Provided by the Springer Nature SharedIt content-sharing initiative
This article is cited by
Complementary probes for the electrochemical interface.
- Ernest Pastor
- F. Pelayo García de Arquer
Nature Reviews Chemistry (2024)
Applications of the levelized cost concept
- Gunther Friedl
- Lukas Kemmer
Journal of Business Economics (2023)
By submitting a comment you agree to abide by our Terms and Community Guidelines . If you find something abusive or that does not comply with our terms or guidelines please flag it as inappropriate.
Quick links
- Explore articles by subject
- Guide to authors
- Editorial policies
Sign up for the Nature Briefing newsletter — what matters in science, free to your inbox daily.

- S&P Dow Jones Indices
- S&P Global Market Intelligence
- S&P Global Mobility
- S&P Global Commodity Insights
- S&P Global Ratings
- S&P Global Sustainable1
- Investor Relations Overview
- Investor Presentations
- Investor Fact Book
- News Releases
- Quarterly Earnings
- SEC Filings & Reports
- Executive Committee
- Corporate Governance
- Merger Information
- Stock & Dividends
- Shareholder Services
- Contact Investor Relations
- Email Subscription Center
- Media Center
Hydrogen technology faces efficiency disadvantage in power storage race
Despite turmoil, project finance remains keen on offshore wind
An Energy Company Assesses Datacenter Demand for Renewable Energy
Japan M&A By the Numbers: Q4 2023
See the Big Picture: Energy Transition in 2024
- 24 Jun, 2021
- Author Tom DiChristopher
- Theme Energy
Hydrogen will have to leap a significant hurdle to compete with other long-duration energy storage options as the transition to renewable electric power generation accelerates.
While the production and storage of hydrogen have the potential to store excess renewable electric power over long periods of time, the process is far less efficient than other storage technologies, according to Arjun Flora, director of energy finance studies for Europe at the Institute for Energy Economics and Financial Analysis, or IEEFA. This means that the costs for hydrogen production will have to fall substantially before it becomes competitive, Flora said during a June 23 panel at IEEFA's virtual Energy Finance 2021 conference.
"The coming decade will be a development race between hydrogen and all the other long-duration technologies to see who can bring down costs and demonstrate large-scale feasibility," Flora said.
Government and industry stakeholders have lately ramped up efforts to produce green hydrogen, a zero-carbon gas produced through the electrolysis of water powered by electricity from renewable power generation. The idea is to "store" renewable electricity as hydrogen during periods when the electricity is not needed, rather than curtailing generation.
Green hydrogen can then be used as a fuel to generate electric power in a turbine or fuel cell. This application has been gaining momentum in the emerging hydrogen economy. However, Flora noted that converting power to hydrogen and then using the fuel to generate power has a relatively low round-trip efficiency. Round-trip efficiency is the percentage of electricity retrieved after being stored.
The technology to convert power to hydrogen and back to power has a round-trip efficiency of 18%-46%, according to data that Flora presented from the Massachusetts Institute of Technology and scientific journal Nature Energy . In comparison, two mature long-duration technologies, pumped-storage hydropower and compressed air energy storage, boast round-trip efficiencies of 70%-85% and 42%-67%, respectively. Flow batteries, a rechargeable fuel cell technology that is less mature, have a round-trip efficiency of 60%-80%.
Still, pumped hydro and compressed air energy come with geographic and environmental constraints, Flora noted, adding that pumped hydro requires a water reservoir, while conventional compressed air energy requires burning fossil fuels.
Achieving the economics that will drive the adoption of storage technologies at scale will require low up-front capital expenditures and ongoing operating expenses that can be recouped quickly through future revenues, Flora said. "To attract investment, it is important that revenues are as visible and predictable as possible, and this is really where storage has struggled," Flora said. "Technology costs have been high and the revenue streams are not always clear or predictable, even if the technical benefits are there."
Aligning technical benefits with economics will call for market or regulatory frameworks that compensate the operators of storage assets for the benefits they provide, including flexibility, deferral of network investment and ancillary services like frequency control, Flora added.
There are a number of attempts underway to drive down the cost of green hydrogen production from roughly $5/kg to $1-$1.50/kg over roughly a decade. This will require low electricity costs and electrolyzer price reductions. The U.S. Energy Department recently launched a program to cut green hydrogen costs, and price reduction is a core goal for a partnership aiming to develop a green hydrogen hub in Los Angeles.
- Tom DiChristopher
Round-trip Efficiency of Ammonia as a Renewable Energy Transportation Media
By trevor brown on october 20, 2017.
A new study has made a major addition to the available literature on the economic benefits of ammonia energy. This latest study, published by researchers from CSIRO in Australia, provides the data needed to define the round-trip efficiency of using ammonia as a sustainable fuel and hydrogen carrier.
Ammonia as a Renewable Energy Transportation Media
The team at CSIRO, the Commonwealth Scientific and Industrial Research Organization, in Australia, begins its analysis of the round-trip efficiency of using ammonia as a fuel with an examination of the energy efficiency of ammonia synthesis technologies, then considers the energy cost of intermediate processes, like ammonia cracking and hydrogen storage and compression, and concludes with an assessment of fuel efficiency at the point of delivery.
At the outset, we must acknowledge the paper’s title: “Ammonia as a Renewable Energy Transportation Media.” The authors are quite clear that, relative to making ammonia, using renewable electricity directly “would clearly be far more efficient” given the distribution losses of only “less than 10%” in most electrical grids. CSIRO makes a similar case for directly charging electric vehicles because “losses during charging … are typically significantly less than 20%.”
Therefore, CSIRO provides the best argument for the use of ammonia as an energy vector:
Conversion of renewable energy to a fuel would only be considered viable if the energy is to be transported over long distances by ship, the energy needs to be stored for extended (months) periods of time or there is another engineering constraint that precludes the direct use of the generated electricity. Giddey et al, Ammonia as a Renewable Energy Transportation Media , ACS Sustainable Chemistry & Engineering, 09/27/2017
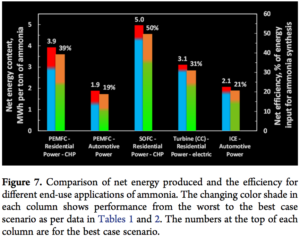
The CSIRO study specifically elucidates three end-use scenarios for ammonia fuel, quantifying the round-trip efficiency of ammonia as: (1) a high-purity hydrogen carrier for fuel cell vehicles (PEMFC), (2) a hydrogen carrier for stationary fuel cells (SOFC), and (3) a direct fuel for internal combustion engines and gas turbines.
CSIRO has published these findings as ranges, taking into account both the best-case and worst-case assumptions for the energy performance of these various technologies in various applications, including both automative and residential power (CHP and electric).
Despite the low efficiencies and different levels of maturity of the chain of technologies discussed, ammonia remains an excellent proposition for converting RE [renewable energy] to hydrogen and then to ammonia, transporting it to locations with low renewable energy intensity and converting the ammonia back to hydrogen for local consumption. The RTE [round-trip efficiency] of electrical energy storage (battery, supercapacitors) can be higher than 80%. However, the end use and generation locations have to be in close proximity. Liquid hydrogen and methanol, despite also being alternative energy vectors, have lower RTE values [than ammonia] as estimated in previous studies. Further, the infrastructure required for liquid hydrogen transport is almost nonexistent and methanol is an emission producing fuel at the point of use; make these alternatives less attractive at this stage. Ammonia therefore provides an attractive option in terms of RTE, as well as being an emission-less energy carrier. Giddey et al, Ammonia as a Renewable Energy Transportation Media , ACS Sustainable Chemistry & Engineering, 09/27/2017
Technical considerations
Energy content of ammonia The CSIRO paper begins by defining ammonia as either having an energy content of 5.17 MWh per metric ton if used as a direct fuel (based on ammonia’s lower heating value, LHV), or having a hydrogen energy content of 5.91 MWh/ton if cracked back into hydrogen before use in a hydrogen fuel cell (based on hydrogen’s LHV). The increase in energy content between these two values, from ammonia’s use as a direct fuel use to its use a hydrogen carrier, would be supplied externally from the endothermic (0.75 MWh/ton ammonia) cracking reaction that separates the hydrogen (H 2 ) from the ammonia (NH 3 ).
Energy input required to produce ammonia The energy input required to synthesize ammonia from fossil fuels is given as 7.8, 10.6, and 11.7 MWh/ton ammonia for feedstocks of natural gas (SMR), coal, and fuel oil respectively, or roughly 8-12 MWh/ton ammonia. These are “best practice energy consumption values … dependent on the region, plant size, and the source of hydrogen (feedstock).” The study quotes but does not incorporate in its energy assessments the associated emissions of 1.6, 3.0, and 3.8 tons CO 2 per ton ammonia, respectively, for each fossil feedstock.
For renewable ammonia synthesis technologies, the CSIRO study defines an energy input range of 10-12 MWh/ton ammonia, assuming that renewable energy (solar, tidal, or wind) is used to power an electrolyzer and an ASU (air separation unit), with the resulting hydrogen and nitrogen fed into a Haber-Bosch ammonia synthesis loop.
(The authors also give us a sense of long-term technological potential. Today’s SMR-fed Haber-Bosch is more or less at its technical limit of a “best practice” 7.8 MWh/ton ammonia; CSIRO gives the “theoretical electric input required to produce hydrogen by the electrolysis of water,” as 7 MWh/ton ammonia. While we may be able to make ammonia sustainably, from renewable power, it will always be an energy-intensive process.)
With an eye on the future, the CSIRO authors also acknowledge direct electrochemical ammonia synthesis technologies, which might one day replace Haber-Bosch, but their assumptions do not rely upon the commercialization of these technologies because the energy efficiencies demonstrated thus far “need to be improved at least by 1−2 orders of magnitude to allow for commercial use.” And this team should know: the lead author, Sarb Giddey, was the influential originator of the Giddey Commercial Benchmark for electrochemical ammonia synthesis technologies.
Energy Cost of NH 3 Cracking / H 2 Compression & Storage Trace amounts of ammonia in a hydrogen fuel supply would “irreversibly damage” a PEMFC. If ammonia is under consideration as a hydrogen carrier for these fuel cells, therefore, high-purity cracking technologies “require specific attention.” (This is the argument driving CSIRO’s development of its own hydrogen purification membrane .)
In this study, “the net energy required for the ammonia cracking has been calculated to be 0.28 and 0.30 MWh per ton ammonia,” for best and worst case scenarios. This is in addition to the 15% “loss of hydrogen” in cracking, equal to 1.13 MWh/ton ammonia. The ammonia cracker, therefore, leads to total losses “estimated to be 1.41 MWh per ton (equates to overall ammonia cracker efficiency 76%) for best case scenario.”
Likewise, the study considers hydrogen compression and storage technologies – after all, this RTE assessment of ammonia as a hydrogen carrier is only relevant in relation to the RTE of hydrogen itself; the study also considers methanol, as an alternative synthetic fuel. The hydrogen compression technologies considered include mechanical compression (40-50% efficient), electrochemical compression (potentially 70-80% efficient), and chemical compression using metal hydrides (less than 30% efficient, but offering the “opportunity to utilize waste heat, where available”).
For example, in the PEMFC vehicle scenario, hydrogen compression losses (including precooling) amount to “12−17% which equates to compression related losses of 0.54 – 0.67 MWh per ton ammonia.”
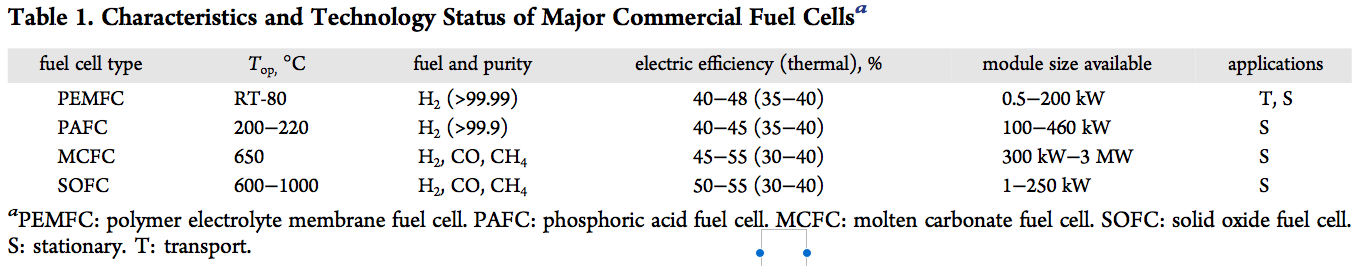
Theoretical results
Scenario 1: High Purity Hydrogen Production for Use in Fuel Cell Vehicles Assuming that ammonia is produced from completely renewable power, cracked into high-purity hydrogen, and used in a PEMFC to power a vehicle, the “net efficiency for worst and best case scenario … is between 11% and 19%.”
For comparison, although the CSIRO paper does not refer to contemporary fossil-fueled cars, the gasoline or diesel vehicle equivalent of this same round-trip efficiency calculation is a carbon-fueled well-to-wheel efficiency of roughly 20% .
Scenario 2: Ammonia Utilization for Stationary Applications via Fuel Cells For the best and worst case technologies considered for stationary power fuel cells, the “net combined heat and power (CHP) efficiency … was 25−39% … Thus, starting with one MWh renewable energy input, the net energy delivered to the grid or a distributed site for the best case scenario would be 214 kWh in the form of electricity and 179 kWh low grade heat.”
This was the highest-efficiency use-case identified in this study.
Scenario 3: Ammonia Combustion in a Turbine (Stationary) or Modified IC Engine (Transport) The CSIRO paper provides overall efficiency data for ammonia in internal combustion engines (ICEs) (35-40%) and combined cycle gas turbines (55-60%), from which it derives best- and worst-case RTE value ranges from 15-21% in ICEs and, in turbines, “24 to 31% (electric) of the input renewable energy depending on the hydrogen production system used.”
As I have mentioned, these apparently “low” values relate to an incumbent energy system based upon a ~20% well-to-wheel gasoline-fueled internal combustion engine.
The CSIRO paper compares these ammonia data against “a number of studies investigating the round trip efficiency of methanol and liquid hydrogen pathways” for alternative fuel uses, and concludes that “neither liquid hydrogen nor methanol offer a significant efficiency gain in most cases … [for example, according to one paper] the overall efficiency was 9.3% for methanol and 8.7% for liquid hydrogen vectors.”
- POWER Plant ID
- POWER Events
- Connected Plant
- Distributed Energy
- International
- COVID-19 Coverage
- Carbon Capture
- Climate change
- Cybersecurity
- Distributed Power
- Electric Vehicles
- Energy Storage
- Environmental
- Instrumentation & Controls
- Legal & Regulatory
- Legislative
- Ocean/Marine
- Physical security
- Plant Design
- Power Demand
- Research and Development
- Supply Chains
- Tidal Power
- Waste to Energy
- About POWER
- Privacy Policy
- Cookie Settings
- Diversity, Equity, Inclusion & Belonging
- Accessibility Statement
Don’t Neglect Round-Trip Efficiency and Cost of Charging When Considering Levelized Cost of Storage
The world is moving toward renewable sources for electricity generation in an attempt to reduce fossil-fuel reliance. But wind and solar can’t provide a consistent flow of power 24/7, and grid operators have realized that new electricity generation needs to be paired with storage to manage periods with no sun or wind.
The decreasing cost of lithium-ion batteries has made battery energy storage systems (BESS) more affordable; however, the cost of battery storage systems represents only 20%-25% of any project’s lifetime cost. Power equipment, land, site work, cabling, project design and management, grid integration, transportation, and other related up-front costs represent another 25%.
So, what makes up the other ~50%? Operations and maintenance, otherwise known as O&M, represent a few percentage points. O&M generally includes expenses associated with maintaining, repairing, and operating energy storage systems over their lifespan. The rest comes from the cost of electricity to charge the system, which is significantly affected by the system’s overall round-trip efficiency (RTE).
Why RTE and Cost of Energy Matter
Levelized cost of storage (LCOS) is a metric used to determine the cost per unit of energy discharged from an energy storage system. The calculation is usually expressed in dollars per megawatt hour (MWh) and includes initial costs plus operating costs divided by the energy discharged over the asset’s service life.

There are dozens of potential variables that may be used to determine the true levelized cost of storage, and different vendors will add, omit, or adjust different ones to put their products in the best light. This is why it’s so important to understand the role of RTE and cost of energy in a storage system, because they often have the biggest impact. These are also components that vendors with low-RTE technologies will most often discount (or omit altogether).
Round-trip efficiency is a measure of the amount of energy put into a system compared to the amount dispatched, and is expressed as a percentage. A system with a high RTE (75%+) is able to dispatch most of the energy fed into it. A low RTE indicates that the system loses a considerable amount of energy, often to heat arising from irreversible side reactions or high internal cell resistance. Many long-duration energy storage systems have RTEs below 50%, creating a significant amount of energy waste.
For example, lithium-ion batteries generally have RTEs of 90%+. In contrast, lead-acid batteries have lower RTEs of around 70%, meaning that approximately 30% of charge energy is lost. RTEs for flow batteries can range from 50%–75%, while metal-air batteries could have RTEs as low as 40%.
If the electricity used to charge low-RTE batteries was free, efficiency might not matter much. But electricity always comes with a cost. Some might argue that during periods where supply exceeds demand, renewables could be used to charge batteries when they would otherwise be curtailed. There’s a logic to that, but curtailment periods can’t always be predicted.
Even if you’re using electricity that would otherwise be curtailed, you have to assign a monetary value. If a turbine is spinning or a solar panel is generating electricity and a battery system is storing that electricity, every component in the system is subject to normal wear and tear plus maintenance and replacement protocols—all of which have costs associated. Factors at play include:
Technology lifespan and degradation rate. An energy storage system’s service life is determined by technology and cycles. All energy storage systems deteriorate over time, making them less efficient at storing and discharging energy. The same goes for generation sources. From solar to wind to flow batteries to lithium-ion, the more the components are used, the shorter the lifespan and the sooner the need for repair, replacement or augmentation.
Maintenance costs. Solar panels, wind turbines, battery systems, transmission lines, and power equipment all have to be maintained. The more they’re used, the more often components need to be serviced or replaced.
Long-Duration Doesn’t Always Mean Lower LCOS
The latest buzzy term in the energy space is “long-duration energy storage,” or LDES for short. While there’s no single definition of what the term means, the term has generally come to describe a non-lithium storage technology that can provide energy for anywhere from 8 to 160 hours at a lower installed cost per MW than lithium-ion batteries or a standard natural gas turbine.
LDES isn’t confined to battery storage; non-battery technologies include compressed air, latent heat, flywheels, and more. In fact, pumped hydro currently accounts for the vast majority of all LDES capacity in the US, and will likely remain in that position for an extended time. Battery technologies being positioned for LDES use include flow batteries, zinc-based chemistries, metal air, nickel hydrogen, and more.
These technologies all work well and are generally safer than lithium-ion batteries, but they come with trade-offs. Many have high up-front costs and must be amortized over 30–40-year periods to be cost competitive. Some have very low energy densities, requiring significant amounts of land for installations above a few megawatt hours. Some are rate-limited and can’t discharge as quickly as needed for specific applications. Some have very restricted siting requirements. And maybe most importantly, many have RTEs below 60%, with a few at 40% or lower.
So, what does this all mean? The race is on to build a better storage system, and with no universal standard for calculating LCOS, every vendor is using a model that plays to the strength of their own technology. If you’re investigating a new storage technology, be sure to ask a few questions when LCOS numbers come up, such as:
How many years are they calculating when it comes to system life? Lithium-ion batteries usually have to be augmented or replaced somewhere between 10 and 15 years of use; vendors with low densities or high installed costs may calculate over 30–40 years to lower their LCOS while factoring in two or more replacement cycles for lithium-ion.
What are they using for the cost of electricity to charge the system, and how does that compare with your actual costs? Even if you’re only planning to charge the system during periods you’d normally be curtailing renewables, remember that there’s still a cost to running those systems. A system with a low RTE may end up having a much higher LCOS even when you’re paying very little for electricity.
Are they including the cost of land in their calculations? If you’re installing a storage facility in a rural area where land is cheap, this may not matter so much. But if you need to place storage in or near a high-cost-of-living area, cost of land (and availability) could be one of your primary concerns and should definitely play a role in the LCOS calculation.
Are they including installation tax credits (ITCs) or production tax credits (PTCs) in their calculations? If so, be sure that the numbers are correct for your projects, and that the same are being applied to any other technologies you’re evaluating.
— Mukesh Chatter is the CEO of Alsym Energy , a technology company developing a low-cost, high-performance rechargeable battery chemistry that is free of lithium and cobalt.
SHARE this article
- Visit the GivEnergy cloud
- All in One – battery plus inverter
- AC coupled inverter
- Hybrid inverter
- Battery storage
- Full energy ecosystem overview
- Find an installer
- Power conversion system (PCS)
- Battery packs
- Commercial battery rack
- SME battery system
- Battery storage container
Energy management software
- GivEnergy app
- GivEnergy portal
- Home battery storage
- Commercial battery storage
- Sustainable construction projects
- Wholesalers
- Energy suppliers – E.ON partner
- Energy suppliers – Octopus
- Energy aggregators
- Solar industry – Open Solar
- Solar industry – Easy PV
- Giv-Gallery
- Case studies
- Support hall of fame
- Why choose GivEnergy?
- Refer a friend
- Find a distributor
- Knowledge base
- Community forum
Documentation
- Resource hub
- Product brochure 2024
- GivEnergy API
- Server status
- View all posts

Standalone battery storage without solar: the unsung hero of energy...

GivEnergy All in One 3.6 or 6.0? Which one is...

What is IP65 rating? ‘Is my GivEnergy home battery waterproof?’
- FIND AN INSTALLER

- January 30, 2024
- Blog , Commercial battery storage , Domestic battery storage , Explain like I’m 5
What is round trip efficiency in battery storage?
Round trip efficiency (RTE) is a measure of how efficiently a battery can store and discharge energy. Find out why it’s crucial in the world of BESS.
Terminology in the world of battery storage can seem daunting to the average Joe.

Luckily, we’re here to help.
Round trip efficiency (RTE) is something you may have come across in relation to batteries.
In a nutshell, RTE measures how efficiently a battery can store and discharge energy.
How is RTE calculated? Why are there no batteries with 100% RTE? How has RTE in storage batteries improved in recent years?
Read on to find the answers to these questions.
How to calculate the RTE of a battery?
The RTE of a battery can be calculated as a percentage using a simple formula shown below:
Energy output ÷ energy input x 100 = RTE
Let’s demonstrate what this means in practical terms with an example.
Mrs Jones installs a storage battery for her home . As she and her family typically use 10 kWh of electricity per day, she opts for a 10 kWh storage battery.
As someone who is both eco-conscious and has an above-average income, Mrs Jones installs both solar panels and a wind turbine to power her battery storage system. This means she can charge her 10 kWh battery from renewable sources.

However, Mrs Jones soon realises that she isn’t getting 10 kWh per day from her storage battery.
In reality, she gets 8 kWh per day. That’s because her 10 kWh battery has 80% round trip efficiency.
If she had opted for a 10 kWh battery with 90% round trip efficiency, she would get… yep… 9 kWh per day.
For her remaining 2 kWh per day of electricity needs, she draws energy from the grid.
Why do batteries lose energy?
Unfortunately, batteries always lose a small amount of energy during operation.
This is usually because of heat loss, self-discharge, high internal cell resistance or other factors.
Are there any batteries with 100% RTE?
You can think of it like this: if anyone ever tries to sell you a 100% RTE battery, run a mile because they’re almost certainly lying.
What is the RTE of a typical battery?
RTE varies among different types of storage batteries .

For older battery systems, 80% round trip efficiency would have been considered a good standard. Some evidence suggests the typical lithium-ion battery – a popular choice for modern battery energy storage systems and electric vehicles – has round trip efficiency of around 83%.
GivEnergy’s own batteries – using LiFePO4 (lithium iron phosphate) – have achieved 93% round trip efficiency .
RTE – not to be ignored
Grid-level battery storage is becoming increasingly common to accommodate the growth in renewables, especially solar and wind.

Round trip efficiency is a factor that decision-makers need to take into account when assessing the overall efficiency of an energy storage system.
And it’s something YOU also need to bear in mind when installing your own battery storage system for your home or business.
Remember: 100% round trip efficiency is a lie! However, 93% round trip efficiency with a GivEnergy battery using LiFePO4 technology is not a lie.
Looking to play your part in the energy storage revolution? Get started by finding an approved GivEnergy installer today.
Further reading
- Explain like I’m 5: depth of discharge
- LiFePO4 battery: what is it & why is it best for BESS?
- The superior choice: embracing LiFePO4 batteries over NMC technology
Quick Links
Getting started with...

Product images used are for illustrative purposes. The finished setup will vary from installation to installation, and will include all your needed cable connections, metering, any (outdoor) canopies, etc.
COMMENTS
Round-trip efficiency is calculated considering the following processes; water electrolysis for hydrogen production, compressed, liquefied or metal-hydride for hydrogen storage, fuel-cell-electric-truck for hydrogen distribution and micro-gas turbine for hydrogen power generation. ... Water electrolysis is the dominant technology for the ...
The round trip efficiency is a crucial factor in determining the effectiveness of storage technology. A higher RTE indicates that there is less energy loss during the storage process, resulting in a more efficient overall system. Grid systems engineers strive for energy storage systems to achieve an 80% RTE whenever feasible, as it signifies a ...
Final Round Trip Efficiency. Renewable power sources give a final hydrogen Roundtrip Efficiency of 32.03%. Using Non renewable power (efficiency <40%) gives a hydrogen roundtrip efficiency of < 13.1 %. ... Future Electrolysis Performance. Another area where real progress could be made is in the hydrogen fuel cell. Currently fuel cells are 50% ...
Round trip efficiency : 35%. Power capital ($/kW) 1,500. Storage capital ($/kWh -DC) 35. Stack life years (years) ... (Electrolysis H. 2. Production) Off-peak electricity. 24/day electricity. 24/day electricity. On-peak electricity. ... Rectifier efficiency 98.4% Rectifier cost ($/kW AC) $ 196 Total installation cost factor (% of equipment ...
Even higher efficiencies are obtained for H2O electrolysis with co-fed CO2 to produce CO and CH4. We demonstrate a repeatable round-trip (electricity-to-hydrogen-to-electricity) efficiency of >75% ...
The AFC with an electrolyte gap provides remarkable results as it shows vanishingly small overvoltage during electrolysis at temperatures around 90 °C and current density of 100 mA cm−2: an electrolyzer efficiency of about 100% could be achieved for the single cell. The round-trip efficiency was also very high: 65% were realized with 50 mA ...
The round-trip efficiency of a storage system is a characteristic of the system's operation, ... Electrolysis: Information and Opportunities for Electric Power Utilities, National Renewable Energy Laboratory Technical Report NREL/TP-581-40605, 2006. O. Z. Sharaf and M. F. Orhan, ...
The range of hydrogen prices at which an integrated system generates both outputs hinges, in addition to cost, on the round-trip efficiency and the volatility in power prices (Fig. 1).
The measured round-trip efficiency of the electricity-to-hydrogen-to-electricity conversion in the HRI system, under the chosen operating conditions, is 13.5% after the introduction of a hypothetical air compressor, compared to 18% with oxygen recuperation. Because of its electrochemical irreversibility, and because of the hassles of gas ...
Generating power from electricity stored as hydrogen has lower round-trip efficiency — a measure of energy loss — than other long-duration storage applications. ... a zero-carbon gas produced through the electrolysis of water powered by electricity from renewable power generation. The idea is to "store" renewable electricity as hydrogen ...
Hydrogen can be used as a power medium, and a typical way of using hydrogen is the round trip, defined as a process in which electricity becomes hydrogen and then returns to electricity form. The ...
Hydrogen Round Trip Efficiency . Chao Zheng * De Montfort University, Leicester LE19BH, UK. E-mail: [email protected] ... electrolysis to explore hydrogen round trip efficiency improvement will ...
Hysata. View 2 Images. A kilogram of hydrogen holds 39.4 kWh of energy, but typically costs around 52.5 kWh of energy to create via current commercial electrolyzers. Australian company Hysata says ...
E.g.electrolyser efficiency of 71% x fuel cell efficiency of 45% = round-trip efficiency of 32% 5 A fuel cell is an electrochemical device that works as the reverse of electrolysers by combining ...
pollution. Conventional water electrolysis systems coupled with hydrogen fuel cells are less efficient than lithium-ion batteries at storing electricity. The round -trip efficiency of conventional hydrogen energy storage, combined with high initial capital costs, is a barrier to entry into established energy storage markets.
The RTE [round-trip efficiency] of electrical energy storage (battery, supercapacitors) can be higher than 80%. However, the end use and generation locations have to be in close proximity. ... CSIRO gives the "theoretical electric input required to produce hydrogen by the electrolysis of water," as 7 MWh/ton ammonia. While we may be able to ...
Round-trip efficiency is a measure of the amount of energy put into a system compared to the amount dispatched, and is expressed as a percentage. A system with a high RTE (75%+) is able to ...
RTE varies among different types of storage batteries. For older battery systems, 80% round trip efficiency would have been considered a good standard. Some evidence suggests the typical lithium-ion battery - a popular choice for modern battery energy storage systems and electric vehicles - has round trip efficiency of around 83%. GivEnergy ...
The round-trip efficiency ranges generally between 70 % and 80 %. It takes values inferior to 100 % due to the different losses occurring within the system. The objective of this study is to assess the round-trip efficiency of GES system by evaluating the different factors that cause energy losses during the system's operation.